Artículos
Inversion of two-flux and four-flux radiative transfer models in WO3-NiO electrochromic devices
Inversión de los modelos de transferencia radiativa de dos flujos y de cuatro flujos en dispositivos electrocrómicos de WO3-NiO

Inversion of two-flux and four-flux radiative transfer models in WO3-NiO electrochromic devices
Avances en Ciencias e Ingenierías, vol. 18, núm. 1, pp. 1-29, 2026
Universidad San Francisco de Quito

Esta obra está bajo una Licencia Creative Commons Atribución 4.0 Internacional.
Recepción: 12 Noviembre 2025
Aprobación: 28 Enero 2026
Publicación: 14 Mayo 2026
Abstract: Intrinsic and extrinsic scattering and absorption coefficients (S&A-C) of four inorganic electrochromic device (ECD) samples were determined at their bleached-off optical state (BOOS, 0 V) and at their colored-on optical state (COOS, +3 V DC). The same inversion procedure previously applied to suspended particle device (SPD) and polymer-dispersed liquid crystal (PDLC) samples, approximated for a single layer sandwich structure, was used here for a third smart window technology, based on redox reactions. The four studied ECDs incorporated cathodic WO3 and anodic NiO layers corresponding to the four possible combinations of two thicknesses for each material —single (120 nm) and double (240 nm)— within their sandwich structures. The analysis of their S&A-C was performed in three stages. First, determination of optical constants using the collimated solutions of the fourflux model (4FM) from collimated transmittance and reflectance (T&R) measurements. Second, estimation of extrinsic S&A-C from the two-flux model (2FM) using total (collimated + diffuse) T&R data. Third, extraction of intrinsic S&A-C from the diffuse 4FM solutions by means of diffuse T&R data, employing the diffuse interface reflectance, an approximate average crossing parameter, and the forward scattering ratio. Although light scattering was found to be weak, absorption for the COOS showed a clear dependence on the WO₃–NiO active layers thicknesses: neutral gray ECD11 (single WO3–single NiO), brownish gray ECD12 (single WO3–double NiO), bluish gray ECD21 (double WO3–single NiO), and dark gray ECD22 (double WO3–double NiO). As expected, similar optical appearances were observed in the BOOS for the four ECDs. The values weighted by the CIE 1931 standard observer color matching function (ȳ) indicate that increasing the WO3 thickness twofold leads to a larger absorption coefficient increment than a twofold increase in the NiO thickness. The singlelayer 4FM implementation adopted in this study provides reliable agreement in the 250– 1500 nm wavelength range, while fitting inaccuracies appear beyond 1500 nm (i.e., in the 1500–2500 nm region) between the calculated and the measured diffuse transmittance at BOOS, for ECD11 and ECD22, and at COOS, for ECD11. No fitting inaccuracies were observed between the calculated and the measured diffuse reflectance. Concerning the 2FM study, an excellent agreement in fitting was observed between the calculated and the measured total T&R for the four ECD samples.
Keywords: optical constants, average crossing parameter, forward scattering ratio, diffuse fractions of light, extinction, intrinsic and extrinsic coefficients, smart windows.
Resumen: Los coeficientes de dispersión y absorción (S&A-C) intrínsecos y extrínsecos de cuatro muestras de dispositivo electrocrómico (ECD) inorgánico fueron determinados en su estado óptico aclarado-apagado (BOOS, 0 V) y en su estado óptico coloreado-encendido (COOS, +3 V CC). El mismo procedimiento de inversión previamente aplicado con muestras de un dispositivo de partículas suspendidas (SPD) y de cristales líquidos dispersos en polímero, aproximado para una estructura sándwich de una única capa substrato, fue aquí utilizado para una tercera tecnología de ventanas inteligentes, basada en reacciones redox. Los cuatro ECD estudiados incorporaron capas catódicas de WO3 y capas anódicas de NiO correspondientes a las cuatro combinaciones posibles de dos espesores para cada material —simple (120 nm) y doble (240 nm)— dentro de sus estructuras tipo sándwich. El análisis de sus S&A-C se realizó en tres etapas. Primero, determinación de las constantes ópticas usando las soluciones colimadas del modelo de cuatro flujos (4FM) y considerando las medidas de transmitancia y reflectancia (T&R) colimadas. Segundo, estimación de los S&A-C extrínsecos a partir del modelo de dos flujos (2FM) usando los datos de T&R totales (colimados + difusos). Tercero, extracción de los S&A-C intrínsecos a partir de las soluciones difusas del 4FM mediante los datos de T&R difusos, empleando la reflectancia difusa de interface, un parámetro de camino promedio aproximado, y el porcentaje de dispersión hacia adelante. Aunque la dispersión de luz resultó ser débil, la absorción para los COOS mostró una dependencia clara con el espesor de las capas activas WO3–NiO: ECD11 gris neutro (simple WO3–simple NiO), ECD12 gris con un tinte marrón (simple WO3–doble NiO), ECD21 gris con un tinte azul (doble WO3–simple NiO) y ECD22 gris oscuro (doble WO3–doble NiO). Como se esperaba, se observaron apariencias ópticas similares para los BOOS de los cuatro ECDs. Los valores ponderados por la función de correspondencia de color del observador estándar CIE 1931 (ȳ) indican que aumentar el espesor de WO3 al doble conduce a un incremento del coeficiente de absorción mayor que un aumento del doble del espesor de NiO. La implementación de 4FM de una sola capa adoptada en este estudio proporciona un acuerdo confiable en el rango de longitud de onda de 250 a 1500 nm, mientras que aparecen imprecisiones de ajuste más allá de los 1500 nm (es decir, en la región de 1500 a 2500 nm) entre la transmitancia difusa calculada y medida en el BOOS, para los ECD11 y ECD22, y en el COOS, para el ECD11. No se observaron imprecisiones de ajuste entre la reflectancia difusa calculada y medida. Respecto al estudio del 2FM, se observó un acuerdo excelente en el ajuste entre la T&R totales calculadas y medidas para las cuatro muestras de ECD
Palabras clave: constantes ópticas, parámetro de camino promedio, porcentaje de dispersión hacia adelante, fracciones difusas de la luz, extinción de la luz, coeficientes intrínsecos y extrínsecos, ventanas inteligentes.
INTRODUCTION
Chromogenic electrochromic devices (ECDs) regulate the amount of transmitted light by applying an external electric potential, making them key components of smart window technologies. The energy consumption for heating, cooling and lighting of buildings (which is around 30-40% of the primary energy used in the world) can be reduced by using smart windows technologies [1]. These devices exhibit two optical states —a bleached-off optical state (BOOS) and a colored-on optical state (COOS)— arising from redox reactions between two electrochromic (EC) materials. Depending on whether coloration is induced by ion insertion or extraction, transition metal oxides display cathodic or anodic electrochromism, respectively (Fig. 1 [1]). In anodic EC materials, coloration results from electrochemical oxidation, while in EC cathodic materials it originates from electrochemical reduction. Both processes involve ion transport through the EC layers and require an ion-storage component. Cathodic coloration is observed in oxides such as Ti, Nb, Mo, Ta, and W, with tungsten oxide (WO3) being the most extensively studied. Conversely, anodic coloration occurs in oxides of Cr, Mn, Fe, Co, Ni, Rh, and Ir, among which nickel oxide (NiO) and iridium oxide (Ir2O3) are widely investigated. The electro-optical characteristics of WO3 (coloring upon ion insertion) and NiO (coloring upon ion extraction) thin films for ECD applications were discussed in [2] (Fig. 2). A typical ECD consists of two transparent electrodes that enclose an ion-conducting electrolyte between the inner WO3 and NiO active films. Indium tin oxide (ITO) is frequently used as a transparent conductive (TC) layer. An all-solid-state configuration for ECD employing ITO-coated glass substrates was developed in [3]. In multilayer optical analyses, such as those performed for a suspended particle device (SPD) sample, ITO was assumed as the TC layers, located on the inner faces of the outer glass substrates in a five-layer sandwich structure, to retrieve the optical constants (OC) of the inner active layer, since the actual TC material was unknown [4]. However, due to the scarcity of indium, fluorinedoped tin oxide (FTO) has emerged as a cost-effective alternative for WO₃/NiO-based ECDs fabricated on glass or flexible substrates [5, 6]. The complex refractive indices of ITO (26 nm thick) [7] and FTO (400 nm thick) [8] films on glass have been characterized across the solar wavelength range (SWR). In [7], Fresnel reflection and transmission coefficients for ITO were calculated using the thin-film approach described in [9, 10, 11, 12], since the incident wavelengths (250–2500 nm) greatly exceeded the layer thickness. For the FTO coating, [8] treated it as a thin film at wavelengths above 1200 nm—approximately three times its thickness—and as a substrate for shorter wavelengths. These analyses established the spectral limit of the optical behavior between a film and a substrate (SLOBFS): the 400 nm FTO layer behaved optically as a substrate when the incident wavelength was roughly three times its thickness, and as a thin film for larger ratios.
![Transition metal elements in the Periodic Table whose oxides (TMOs) exhibit cathodic (blue) and anodic (red) EC behavior [1].](https://revistas.usfq.edu.ec/index.php/avances/article/download/4037/version/5401/5046/44052/726184244012_gf2.png)
FIGURE 1
Transition metal elements in the Periodic Table whose oxides (TMOs) exhibit cathodic (blue) and anodic (red) EC behavior [1].
FIGURE 1. Transition metal elements in the Periodic Table whose oxides (TMOs) exhibit cathodic (blue) and anodic (red) EC behavior [1].
![Sandwich structure of inorganic EC smart windows based on tungsten oxide, nickel oxide, and indium tin oxide (ITO) transparent conductors [2].](https://revistas.usfq.edu.ec/index.php/avances/article/download/4037/version/5401/5046/44053/726184244012_gf3.png)
FIGURE 2
Sandwich structure of inorganic EC smart windows based on tungsten oxide, nickel oxide, and indium tin oxide (ITO) transparent conductors [2].
FIGURE 2. Sandwich structure of inorganic EC smart windows based on tungsten oxide, nickel oxide, and indium tin oxide (ITO) transparent conductors [2].
However, thin films are not considered in this study, which focuses on a single-layer (substrate) approximated analysis of four WO3–NiO ECDs using the procedure established in previous works [13, 14, 15]. The same methodology was previously applied to the SPD sample [13]—analyzed at dark-off and clear-on states—and to polymer-dispersed liquid crystal (PDLC) samples [14, 15]—analyzed at translucent-off and transparent-on states. Each sample contains WO3 and NiO active layers deposited on FTO-coated glass, separated by an electrolyte substrate layer (Fig. 2). The four ECD were characterized for both BOOS and COOS. Collimated, diffuse, and total transmittance (T) and reflectance (R) measurements (T&R-M) were used to determine the OC and the intrinsic and extrinsic S&A-C through the single-layer approach described in [13, 14, 15].
The main contribution of this work, compared with previous studies, lies in evaluating the applicability of the single-layer procedure previously employed for SPD and PDLC samples [13, 14, 15]—where both scattering and absorption occur (with absorption dominating in SPD and scattering in PDLC)—to samples in which scattering is nearly negligible and absorption clearly predominates, such as ECDs. The optical characterization process carried out involves three main stages:
A. First stage: Determination of OC from collimated T&R components
Real (n) and imaginary (κ) parts of the complex refractive index (ñ = n − i∙κ) or OC are obtained from the collimated T&R-M, i.e., the regular T (Treg) and specular R (Rspe). From the OC, the complex Fresnel reflection coefficient is calculated, and its squared modulus yields the collimated interface reflectance (rc), obtaining the same values for external (rce) and internal (rci) components, i.e., a single rc value for both propagation directions (rce = rci). Since all measurements were taken at normal incidence, polarization averaging is unnecessary. The extinction coefficient (ε), related to both scattering and absorption, depends on κ and the wavelength (λ) as ε = 4πκ/λ, resulting in the collimated substrate layer attenuation τc = exp(−ε·dz).
B. Second stage: Estimation of extrinsic S&A-C (S & K) from total T&R components
The Kubelka–Munk two-flux model (KM-2FM) [16] with Saunderson correction [17] is applied to account for interface effects. Analytical hyperbolic solutions for R [16] and for T [18] were used with total T&R-M. Although the KM-2FM was initially formulated for diffuse T (Tdif) and R (Rdif), samples exhibiting both collimated and diffuse components are analyzed using total values (Ttot = Treg + Tdif, Rtot = Rspe + Rdif) [19]. Diffuse light fractions (q) are employed to compute the total interface reflectance ω = rc∙(1−q) + rd∙q, where rd is the diffuse interface reflectance. Two distinct ω values (ω0i and ωδj) appear at the front (z = δ) and back (z = 0) interfaces, corresponding to forward (i) and backward (j) propagation, respectively (using q0i and qδj). For external illumination only from the front interface (iδ = icδ = 1), qδi = 0, and therefore q0j and ω0j are not required. The expressions for q0i and qδj were originally derived from SPD data [20, 21]. In [13], a fitting discrepancy observed in the visible range for Rtot [20, 21] was corrected following a suggestion by David MacAdam (Kodak) to Kottler [22], introducing the critical internal reflection angle (θc) as the upper integration limit for computing rd [23]. Earlier works had integrated up to 90° [19, 24, 25], obtaining different values for external (rde) and internal (rdi) components. However, using θc instead of 90° yielded a single rd value for both propagation directions (rde = rdi), analogous to rc (rce = rci), which resolved the 2FM inconsistencies and enabled the accurate determination of the intrinsic coefficients.
C. Third stage: Extraction of intrinsic S&A-C (α and β) from diffuse T&R components
The Maheu–Letoulozan–Gouesbet four-flux model (MLG-4FM) [26] is applied using the diffuse T&R-M (Tdif and Rdif). The average crossing parameter (ACP) was approximated in [27, 28, 29] using collimated and diffuse intensities at the interfaces: ACP=1+(id0+jdδ)/ (ic0+id0+jcδ+jdδ) = 1+(id0+jdδ)/(i0+jδ), with i0=ic0+id0 and jδ=jcδ+jdδ representing total intensities. The scattering coefficient (α) and forward scattering ratio (FSR) are determined in a fitting process, and the absorption coefficient (β) follows from ε = α + β. The consistency between 2FM and 4FM solutions is verified through feedback relations between ACP and FSR (ACPfb and FSRfb) according to Vargas’s expressions [30]. The same four WO3–NiO ECDs analyzed here were also studied in [31] using a simplified estimation of ACP and FSR:
ACP=1+(Tdif+Rdif)/(Ttot+Rtot), FSR=Tdif/(Tdif+Rdif), later referred to as the RT-method in [32].
![Sandwich structure and principle of operation of an inorganic WO3-NiO based ECD smart window at BOOS (above) and COOS (below) [33].](https://revistas.usfq.edu.ec/index.php/avances/article/download/4037/version/5401/5046/44054/726184244012_gf4.png)
FIGURE 3
Sandwich structure and principle of operation of an inorganic WO3-NiO based ECD smart window at BOOS (above) and COOS (below) [33].
FIGURE 3. Sandwich structure and principle of operation of an inorganic WO3-NiO based ECD smart window at BOOS (above) and COOS (below) [33].
MATERIALS AND METHODS
The optical T&R-M of four WO₃–NiO-based ECD samples—designated as ECD11 (single WO3–single NiO), ECD12 (single WO3–double NiO), ECD21 (double WO3–single NiO), and ECD22 (double WO3–double NiO)—were performed in [31, 33] and are reused in this study following the same analytical procedure described in [13, 14, 15]. The novelties obtained for the WO3–NiO-based ECD samples are related to the second and third stages, i.e., for determining the intrinsic and extrinsic S&A-C, due to the θc limit of the integration used to determine rd (not used in previous procedure [21, 22]). These samples and their measurements were conducted at the Laboratory for Spectroscopy of Materials at the National Institute of Chemistry, Ljubljana, Slovenia. The ECDs share the same sandwichtype configuration as shown in Fig. 3 [33], consisting of TC electrodes, two EC films (WO3 and NiO), and an electrolyte substrate layer. The COOS was achieved by applying a +3 V DC bias, while the BOOS was obtained either at 0 V (open circuit, high impedance) or by applying −3 V DC. Optical characterization was performed using a Perkin Elmer Lambda 950 spectrophotometer equipped with an integrating sphere, which allowed the collection of the diffuse components of both T&R. Total and diffuse T&R-M were recorded across the SWR, from 250 to 2500 nm, with a spectral step of 5 nm. The collimated T&R components were then obtained by subtracting the diffuse T&R-M from the total T&R-M.
In addition to these measurements—used later in the Results section—an extra set of measurements was taken with another spectrometer without an integrating sphere, to acquire the collimated transmitted light intensity through the samples. These data were used to compute the direct T (Tdir=Treg) for the separated WO3 and NiO active layers [31, 33]. These additional measurements were performed on glass–FTO–WO3 and glass–FTO–NiO samples, which were not assembled into complete devices. Instead, they were placed in a cell containing a liquid electrolyte to independently achieve optical switching between BOOS and COOS. Fig. 4 presents the Tdir spectra for WO3 (a), NiO (b), and the calculated WO₃–NiO combination (c) at both optical states. Since for two interfaces “A” and “B” and light propagating in forward (i) and backward (j) directions, TABi=TAi∙TBi/(1-RAj∙RBi), this expression can be approximated as TABi=TAi∙TBi if RAj =RBi=0. This approximation was applied because Rspe for the separated WO3 and NiO active layers could not be measured with the experimental setup used for Tdir. Fig. 4(d) shows the colorimetric results for the spectra in panels (a)–(c). ECD11 and ECD12 contain single WO3, while ECD11 and ECD21 include single NiO. ECD21 and ECD22 use double WO3, and ECD12 and ECD22 use double NiO. Consequently, the approximate colors of ECD11 and ECD22 correspond to neutral grey and dark neutral grey, respectively (due to the doubled active-layer thickness), whereas ECD21 appears bluish neutral grey and ECD12 shows a brownish neutral grey tone.
![Direct transmittance of separated active layers used in the ECD smart window samples: A WO3 B NiO C approximated WO3-NiO and D sRGB coloration appearances determined from CIE Yxy 1931 chromaticity coordinates. In the four subfigures, at BOOS and COOS [31, 33].](https://revistas.usfq.edu.ec/index.php/avances/article/download/4037/version/5401/5046/44055/726184244012_gf5.png)
FIGURE 4:
Direct transmittance of separated active layers used in the ECD smart window samples: A WO3 B NiO C approximated WO3-NiO and D sRGB coloration appearances determined from CIE Yxy 1931 chromaticity coordinates. In the four subfigures, at BOOS and COOS [31, 33].
FIGURE 4: Direct transmittance of separated active layers used in the ECD smart window samples: A WO3B NiO C approximated WO3-NiO and D sRGB coloration appearances determined from CIE Yxy 1931 chromaticity coordinates. In the four subfigures, at BOOS and COOS [31, 33].
RESULTS
As outlined in the Introduction, the same methodology previously applied to SPD and PDLC samples [13, 14, 15] was used here to characterize four WO3–NiO ECDs with two different active-layer thicknesses (120 nm and 240 nm) of their active layers WO3 and
A. First stage: Determination of OC from collimated T&R components
The collimated T&R-M and their fittings for the four ECDs in both BOOS and COOS are shown in Fig. 5. The agreement between measured and fitted data is excellent for both optical states. A higher contrast is observed in Treg (Fig. 5a) than in Rspe (Fig. 5b). In the COOS, T decreases markedly, while R increases slightly across the visible range. The intermediate parameters rc and ε were derived from the MLG-4FM [19] cc equations (Fig. 6). These were obtained by fitting the computed Tcc and Rcc values to the experimental Treg and Rspe data. As expected, rc (Fig. 6a) correlates more closely with Rspe, whereas the attenuation term τc (Fig. 6b) is primarily associated with Treg. The ε coefficients are higher in the COOS than in the BOOS, consistent with the EC response.
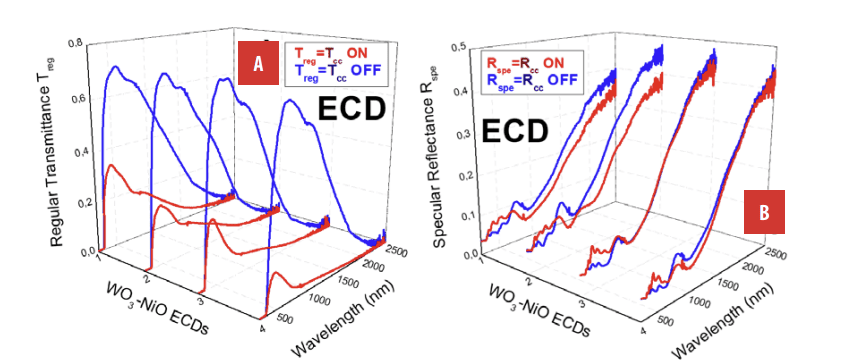
FIGURE 5:
Collimated results: T&R-M and fittings. A Treg and Tcc. B Rspe and Rcc.
FIGURE 5: Collimated results: T&R-M and fittings. A Treg and Tcc. B Rspe and Rcc.
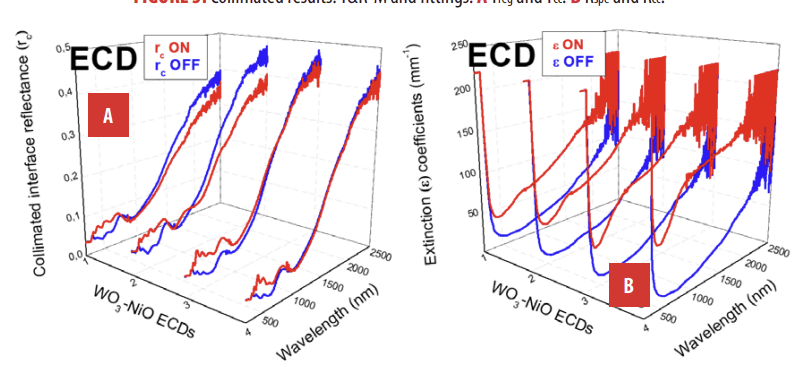
FIGURE 6:
Collimated intermediate parameters: A rc. B ε coefficients (mm-1).
FIGURE 6: Collimated intermediate parameters: A rc. B ε coefficients (mm-1).
B. Second stage: Estimation of extrinsic S&A-C (S & K) from total T&R components
The fitted total T and R (Tt and Rt) are compared with the measured Ttot and Rtot in Fig. 7. Note that almost all light transmitted and reflected by the ECDs is collimated, causing the similarities between Treg (Fig. 7a) and Ttot (Fig. 5a) and between Rspe (Fig. 7b) and Rtot (Fig. 5b). The resulting extrinsic coefficients S and K are displayed in Fig. 8. As expected for ECDs with low optical haze, S (Fig. 8a) remains lower than K (Fig. 8b). Fig. 9a shows q0i and qδj, while Figure 9b presents ω0i and ωδj. The strong inequality qδj >> q0i reflects the fact that, in the backward direction (j) at the front interface (δ), light crosses the internal turbid layer twice, whereas in the forward direction (i) at the rear interface (0), it traverses it only once. Fig. 10a displays the refractive index n, and Fig. 10b the corresponding rd, which describes the diffuse reflection behavior at the interfaces.
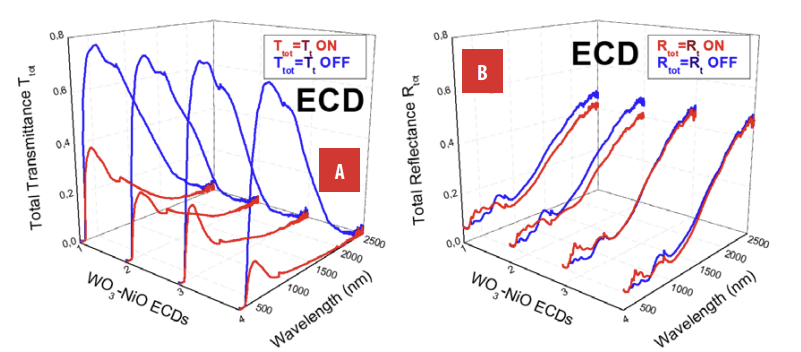
FIGURE 7:
Total results: T&R-M and fittings. A Ttot and Tt B Rtot and Rt.
FIGURE 7: Total results: T&R-M and fittings. A Ttot and TtB Rtot and Rt.
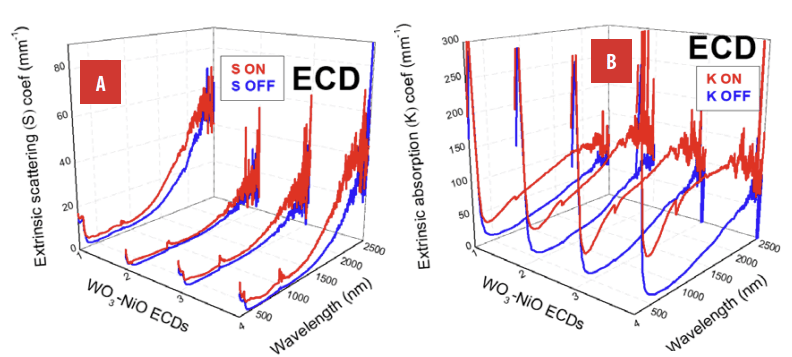
FIGURE 8:
Extrinsic S&A-C (mm-1): A S and B K coefficients.
FIGURE 8: Extrinsic S&A-C (mm-1): A S and B K coefficients.
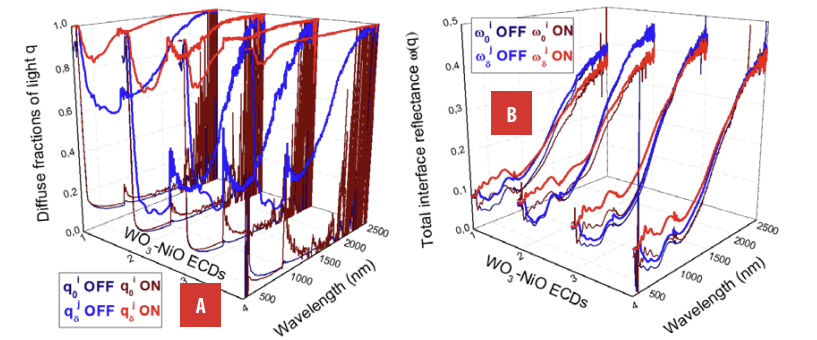
FIGURE 9:
A Diffuse fractions of light q and B total interface reflectance ω.
FIGURE 9: A Diffuse fractions of light q and B total interface reflectance ω.
C. Third stage: Extraction of intrinsic S&A-C (α and β) from diffuse T&R components
The diffuse T&R-M and their fittings to the MLG-4FM [19] cd equations are shown in Fig. 11 for both optical states. The intrinsic coefficients α and β are presented in Fig.12. As observed for the extrinsic coefficients, α (Fig. 12a) remains lower than β (Fig. 12b), consistent with the low haze of the ECDs. The fittings are excellent over most of the SWR. Deviations are observed exclusively in the Tdif of ECD11 and ECD22 at BOOS and of ECD11 at COOS, starting at approximately 1500 nm. Above approximately 2000 nm, an additional increase in fluctuations is observed in Tdif, while Rdif and all collimated and total components remain unaffected over the entire spectral range. This deviation also appears in Fig. 13, where differences between the fitted and feedback (fb) ACP (Fig. 13a) and FSR (Fig. 13b) values become more pronounced above 1500 nm.
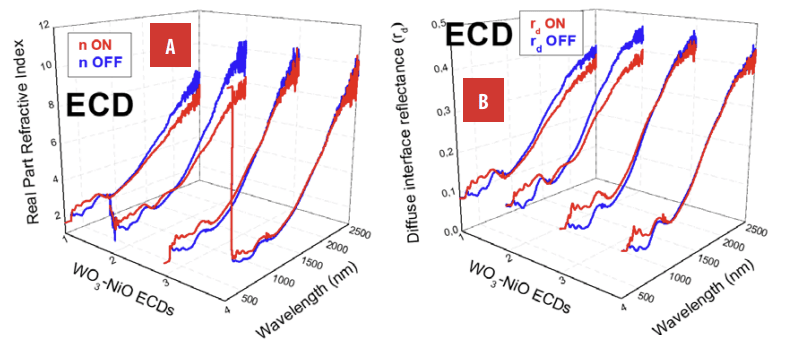
FIGURE 10:
A Real part of refractive index n and B diffuse interface reflectance rd.
FIGURE 10: A Real part of refractive index n and B diffuse interface reflectance rd.
For improved clarity, the fittings of the collimated, diffuse, and total T&R measurements to the calculated values obtained using the 4FM (collimated T&R in Fig. 5 and diffuse T&R in Fig. 7) and the 2FM (total T&R in Fig. 11), for both BOOS and COOS, are presented in Fig. 14 (transmittance) and Fig. 15 (reflectance). The only discrepancies between calculated and measured data are observed in the diffuse transmittance for ECD11 and ECD22 at BOOS, and for ECD11 at COOS, consistently within the wavelength range of 1500–2500 nm. The fitting error within the 250–1500 nm range is negligible compared to the experimental uncertainty.
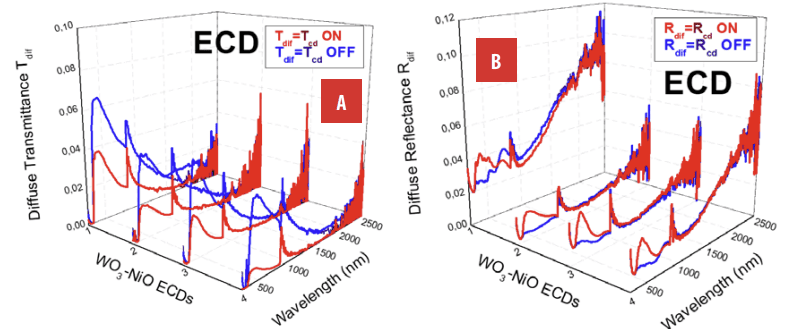
FIGURE 11:
Diffuse results: T&R-M and fittings. A Tdif and Tcd B Rdif, and Rcd.
FIGURE 11: Diffuse results: T&R-M and fittings. A Tdif and TcdB Rdif, and Rcd.
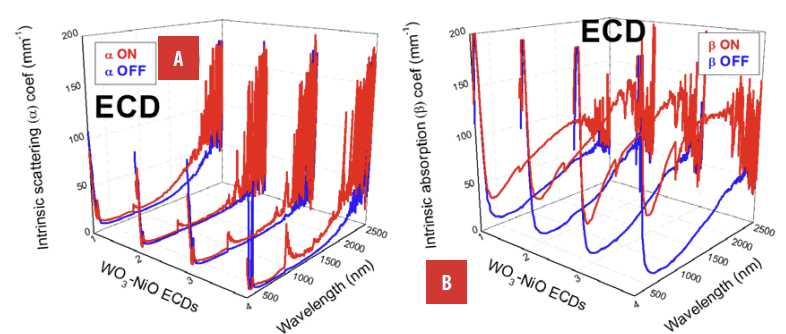
FIGURE 12:
Intrinsic S&A-C: A α and B β (mm-1).
FIGURE 12: Intrinsic S&A-C: A α and B β (mm-1).
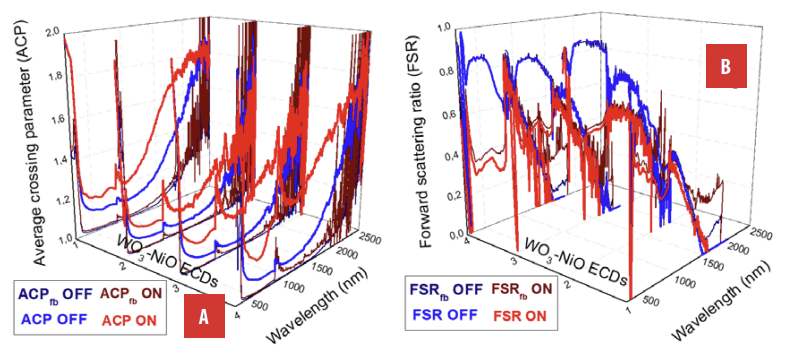
FIGURE 13:
A ACP and ACPfb B FSR and FSRfb.
FIGURE 13: A ACP and ACPfbB FSR and FSRfb.
DISCUSSION
The onset of the discrepancies around 1500 nm precedes the spectral region where instrumental noise becomes significant. Therefore, the deviations observed between 1500 and 2000 nm are mainly attributed to the simplifying assumptions of the present single-layer implementation of the IJ-method, in which identical ACP and FSR values are assumed for both propagation directions and for both collimated and diffuse radiation. For wavelengths above approximately 2000 nm, the quality of the diffuse transmittance measurements is additionally affected by experimental noise. This originates from the absence of a standard light trap (black cone) in the integrating sphere, which was replaced by black sandpaper, leading to increased fluctuations in the diffuse signal. This effect does not influence the reflectance measurements.
Beyond the internal consistency of the 4FM and 2FM formulations, it is important to position the present approach within the broader framework of optical modeling of electrochromic devices (ECDs). Conventional methods such as the transfer-matrix method (TMM) and effective medium theory (EMT) are widely used to describe multilayer optical systems. While these approaches provide rigorous solutions when the complex refractive indices and precise thicknesses of each layer are known, they typically focus on coherent propagation and specular components. In contrast, the present 4FM formalism operates directly with radiometric quantities and explicitly separates collimated and diffuse contributions, allowing experimental validation without requiring detailed microscopic optical constants. This makes the method particularly suitable for practical ECD characterization, where scattering and absorption coexist and may vary with the EC state.
Furthermore, the distinction between intrinsic (4FM) and extrinsic (2FM) coefficients provides additional diagnostic value. The intrinsic formulation captures the full internal radiative transport within the multilayer structure, whereas the extrinsic approximation neglects higher-order internal interactions. The discrepancy between both formulations therefore quantifies the impact of multiple scattering and nonlinear absorption effects, especially under strong coloration (COOS). This separation is not merely mathematical but offers a practical tool to identify performance limitations and to guide multilayer optimization strategies in ECD design. Overall, these results demonstrate that the IJ-based 4FM formulation not only reproduces the spectral response of electrochromic multilayer devices with high accuracy in the 250–1500 nm range, but also provides physically interpretable intrinsic parameters that enable separation of absorption and scattering mechanisms and quantitative assessment of multilayer coupling effects. This dual capability distinguishes the present approach from conventional purely coherent optical models and highlights its relevance for practical ECD analysis and optimization.
To predict the optical appearance of the four ECDs from the T data of the isolated WO3 and NiO EC active layers shown in Fig. 4a [31, 33], the T of the four ECD was calculated in Fig. 16 over the visible wavelength range (VWR) using the approximation Tabi=Tai∙Tbi, described at the last paragraph of the Introduction. The approximated T were then compared with the measured Treg values of Fig. 5a (also plotted in Fig. 14a for BOOS and in Fig. 14b for COOS, together with the excellent agreement in fittings). Neglecting the glass, FTO, and electrolyte layers, as well as the R of the EC WO3 and NiO active layers, the approximation assumed Tabi=Tai∙Tbi, where Tai corresponds to WO₃ (single or double) and Tbi to NiO (single or double). The T of double-thickness layers was obtained as the square of the single-thickness T, i.e., Tb2=Tbi∙Tbi for the BOOS and Tc2=Tc1∙Tc1 for the COOS, as shown in Figs. 16a and 16b for WO3 and NiO, respectively. In this way, Tbi, Tb2, Tc1 and Tc2 are the T of constructed single layer (Tb1 and Tc1) and of simulated double layers (Tb2 and Tc2) for separated EC layers, i.e., for WO3 in Fig. 16a and for NiO in Fig. 16b. These Tai and Tbi values were then used to approximate the calculated T shown in Fig. 16c (Tx11=Tx1∙Tx1, Tx12=Tx1∙Tx2, Tx21=Tx2∙Tx1 and Tx22=Tx2∙Tx2, with x = b for BOOS and x = c for COOS). To test the approximation Tabi=Tai∙Tbi, the calculated T shown in Fig. 16c can be compared with the measured T spectra in Fig. 16d (in Fig. 5a and in Fig. 14a and 14b for the SWR), for ECD11, ECD12, ECD21, and ECD22).
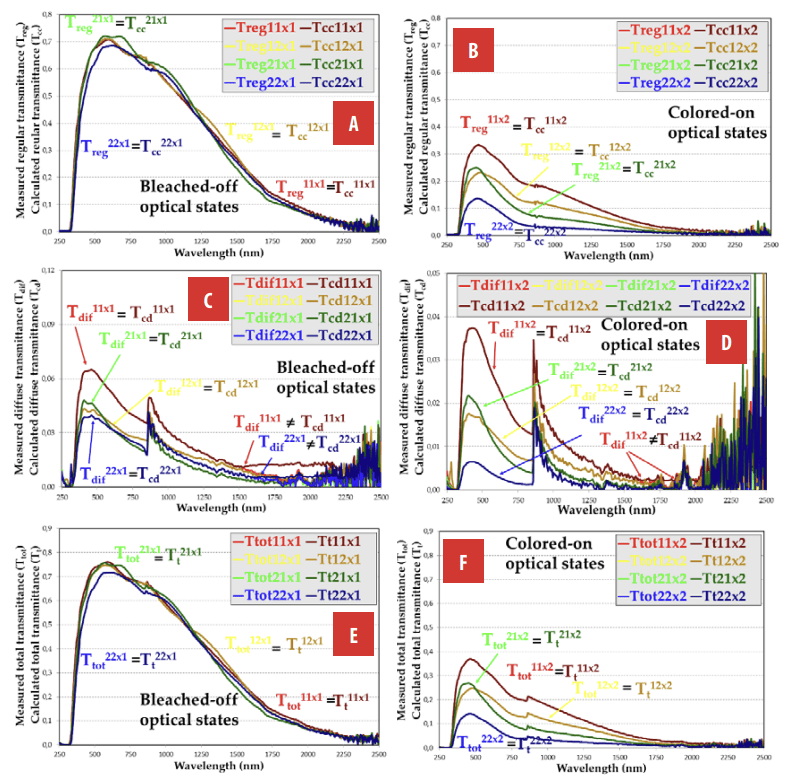
FIGURE 14:
Measured and calculated T of the four WO3-NiO ECDs: BOOS A and COOS B regular T, BOOS C and COOS D diffuse T, and BOOS E and COOS F total T. Discrepancies only between Tdif and Tcd for ECD11 and ECD22 samples.
FIGURE 14: Measured and calculated T of the four WO3-NiO ECDs: BOOS A and COOS B regular T, BOOS C and COOS D diffuse T, and BOOS E and COOS F total T. Discrepancies only between Tdif and Tcd for ECD11 and ECD22 samples.
From the measured collimated T (Treg) shown in Fig. 16 for the VWR, the CIE 1931 xy chromaticity coordinates of the four WO3–NiO ECDs for both BOOS and COOS were determined and presented in Fig. 17. For separated EC layers, T values of Fig. 16a and 16b are used to determine the CIE 1931 xy values for BOOS1, BOOS2, COOS1 and COOS2, of Fig. 17a and Fig. 17b, respectively. Concerning the ECDs, for the calculated cases, the BOOS11, BOOS12, BOOS21 and BOOS22 (of Fig. 17c) and the COOS11, COOS12, COOS21 and COOS22 (of Fig. 17d) were determined with the Tb11, Tb12, Tb21 and Tb22 and the Tc11, Tc12, Tc21 and Tc22 of Fig. 16c. In the same way, for the measured cases, the CIE 1931 xy values of Fig. 17e and Fig. 17f were determined with the data of Fig. 16d. Comparison of the calculated with the approximation and the measured ECDs can be carried out with Fig. 16c and Fig. 16d, for T data, and with Fig. 17c and Fig. 17e, for BOOS and with Fig. 17d and Fig. 17f, for COOS, for CIE 1931 chromaticity values.
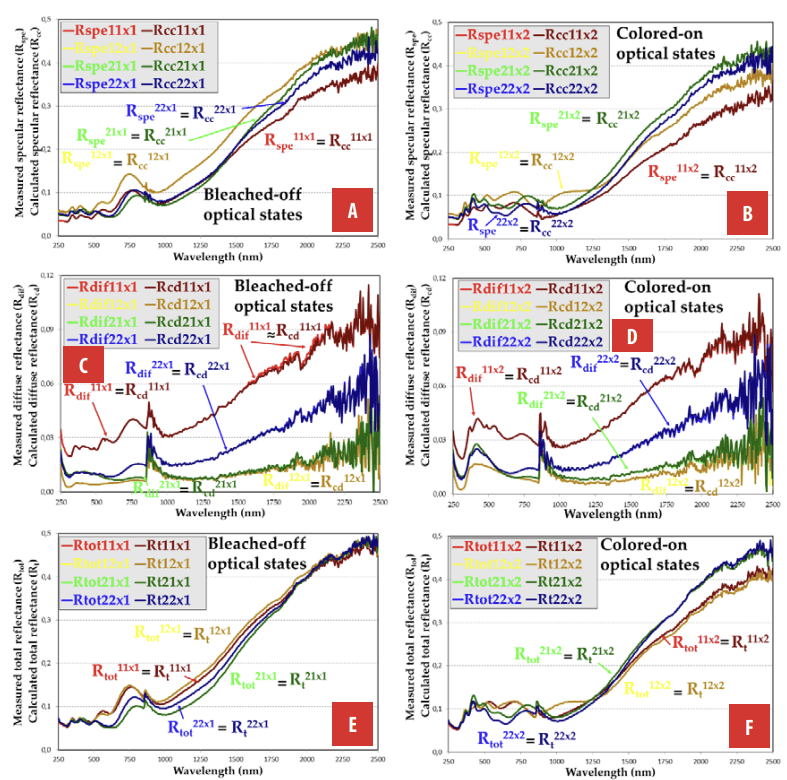
FIGURE 15:
Measured and calculated R of the four WO3-NiO ECDs: BOOS A and COOS B specular R, BOOS C and COOS D diffuse R, and BOOS E and COOS F total R. No discrepancies between measured and calculated R.
FIGURE 15: Measured and calculated R of the four WO3-NiO ECDs: BOOS A and COOS B specular R, BOOS C and COOS D diffuse R, and BOOS E and COOS F total R. No discrepancies between measured and calculated R.
Given that the IJ method employed in this study for the 4FM provides reliable agreement within 250–1500 nm wavelength range, the determination of the intrinsic scattering and absorption coefficients (S&A-C) for the four ECDs, treated as a single layer in their sandwich configuration, must be considered approximate. The extrinsic S&A-C values should also be regarded as approximations, since the original 2FM was formulated for purely diffuse light propagation [16], owing to the two-flux structure of its governing differential equations. However, it was later suggested that the method can be reasonably extended to samples in which collimated T&R components coexist with diffuse T&R [20]. In any case, because the 4FM incorporates four fluxes instead of two, thereby accounting for additional radiative information, it can be considered, in principle, more accurate than the 2FM. Accordingly, Table 1 reports values averaged over the VWR, weighted by the human eye sensitivity curve, i.e., the CIE 1931 standard observer color matching function ȳ (2°). The numerical values in Table 1 indicate that, for the COOS, the increase in both the intrinsic and extrinsic absorption coefficients is greater for ECD21 than for ECD12; that is, doubling the thickness of WO₃ produces a larger effect than doubling the thickness of NiO.
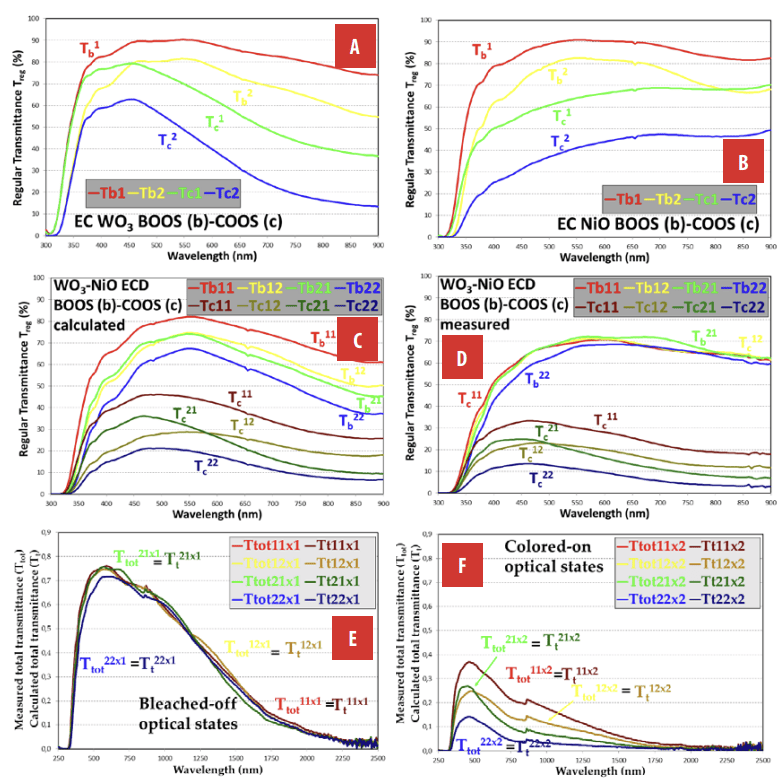
FIGURE 16:
Regular T of the separated electrochromic layers and calculated and measured T for BOOS and COOS. Separated WO3 A and NiO B. Calculated T, neglecting R of separated WO3 and NiO layers, C, and measured T, of ECD11, ECD12, ECD21 and ECD22 D.
FIGURE 16: Regular T of the separated electrochromic layers and calculated and measured T for BOOS and COOS. Separated WO3A and NiO B. Calculated T, neglecting R of separated WO3 and NiO layers, C, and measured T, of ECD11, ECD12, ECD21 and ECD22 D.
TABLE 1: Visible averaged values of intrinsic (α & β) and extrinsic (S & K) scattering and absorption coefficients and of imaginary part of refractive index (κ) obtained for ECD11, ECD12, ECD21 and ECD22, for BOOS and COOS.
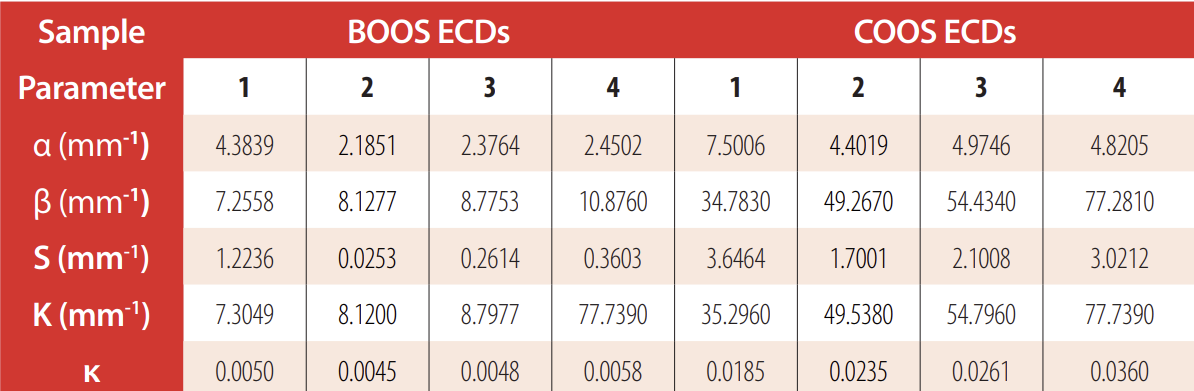
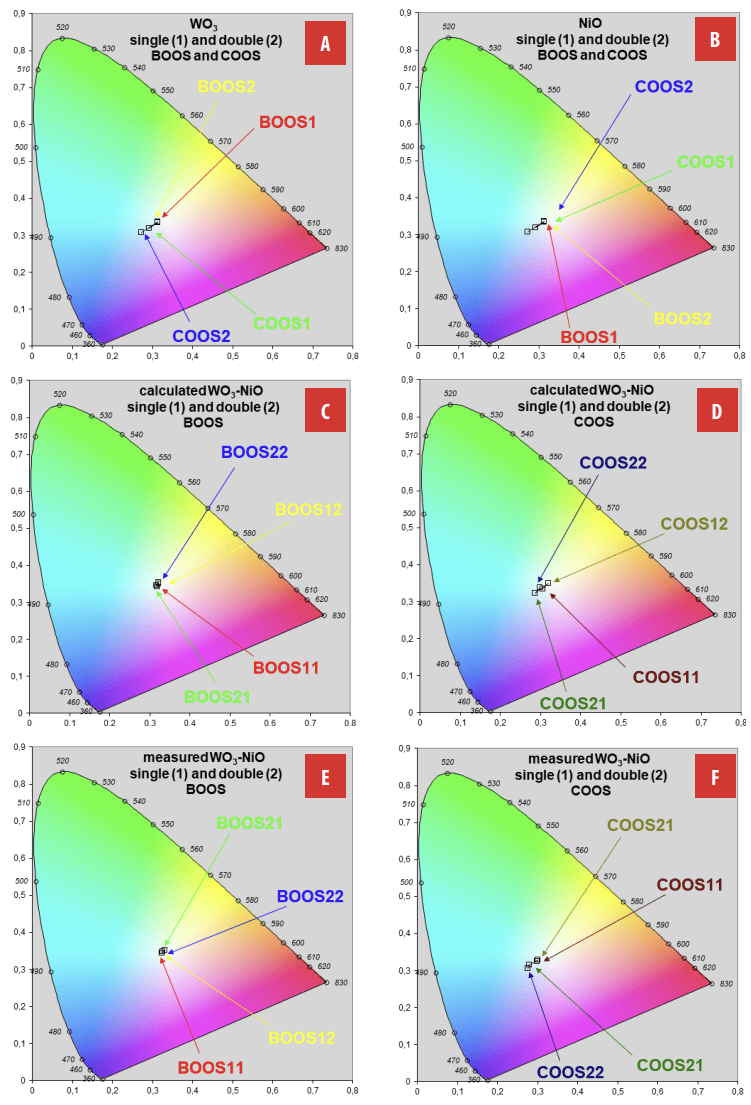
FIGURE 17:
CIE 1931 xy chromaticity diagrams for single and double of separated EC layers at BOOS and COOS A WO₃ B NiO, and of the complete ECDs C calculated BOOS, D calculated COOS, E measured BOOS and F measured COOS.
FIGURE 17: CIE 1931 xy chromaticity diagrams for single and double of separated EC layers at BOOS and COOS A WO₃ B NiO, and of the complete ECDs C calculated BOOS, D calculated COOS, E measured BOOS and F measured COOS.
From the CIE XYZ tristimulus values [34, 35], the sRGB color representations of the four measured ECDs were computed and are displayed in Fig. 18. Accordingly, these results are compared with the calculated colors derived from the approximation, which neglects effects of the outer glass and FTO outer and the inner electrolyte layers, and the R contributions of the individual WO3 and NiO active layers. In this way, colors of inner squares of Fig. 18 were previously shown in the last two rows of Fig. 4d corresponding to WO3 & NiO. The numerical data corresponding to Figs. 17 and 18 are summarized in Table 2.
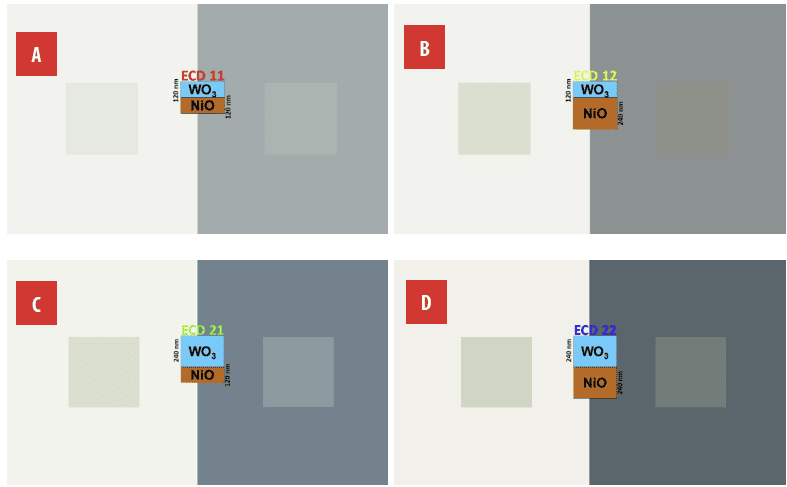
FIGURE 18:
Comparison of the color perception from the determined sRGB values for the four WO3-NiO ECDs A ECD11, B ECD12, C ECD21 and D ECD22, for BOOS and COOS. The inner small square is related to the approximated values.
FIGURE 18: Comparison of the color perception from the determined sRGB values for the four WO3-NiO ECDs A ECD11, B ECD12, C ECD21 and D ECD22, for BOOS and COOS. The inner small square is related to the approximated values.
Note that the values listed in Table 2 correspond to the WO3 and NiO samples with 120 nm thicknesses, whose Tdir spectra are shown in Fig. 4, and to the ECD11, ECD12, ECD21, and ECD22 devices, whose Treg spectra are presented in Fig. 5a. The remaining samples are fictitious, obtained by assuming double thicknesses for WO3 and NiO—denoted WO₃² and NiO²—and represented as squares following the approximation TABi=TAi∙TBi. These fictitious configurations correspond to the ECD11 (WO3·NiO), ECD12 (WO3·NiO²), ECD21 (WO3²·NiO), and ECD22 (WO3²·NiO²). In these representations, the additional layers of the sandwich structure—namely, the outer glass substrates, the FTO TC coatings, and the internal electrolyte—were neglected. The R of the individual WO3 and NiO layers was also disregarded, since only their T was considered. The differences in sRGB values between the measured and fictitious ECDs are smaller for the BOOS than for the COOS, as it can be deduced in Fig. 18. For the BOOS, the percentage deviations in R, G, and B coordinates were calculated as follows: 4.30%, 6.25%, and 7.03% for ECD11; 0.39%, 1.95%, and 1.17% for ECD12; −2.34%, 1.56%, and 2.34% for ECD21; and −4.30%, 0.00%, and −0.39% for ECD22. For the COOS, the corresponding values were 11.33%, 11.33%, and 8.59% for ECD11; 8.98%, 6.25%, and 1.95% for ECD12; 10.94%, 11.72%, and 8.20% for ECD21; and 12.11%, 11.33%, and 7.42% for ECD22. These differences were computed by subtracting the sRGB values of the fictitious samples from those of the measured ones and dividing by 256 (the number of discrete sRGB intensity levels).
TABLE 2. CIE 1931 xy and sRGB values of single and double samples WO3, NiO, WO3∙NiO, WO3∙NiO2, WO32∙NiO, WO32∙NiO2, ECD11, ECD12, ECD21 and ECD22, for BOOS and COOS.
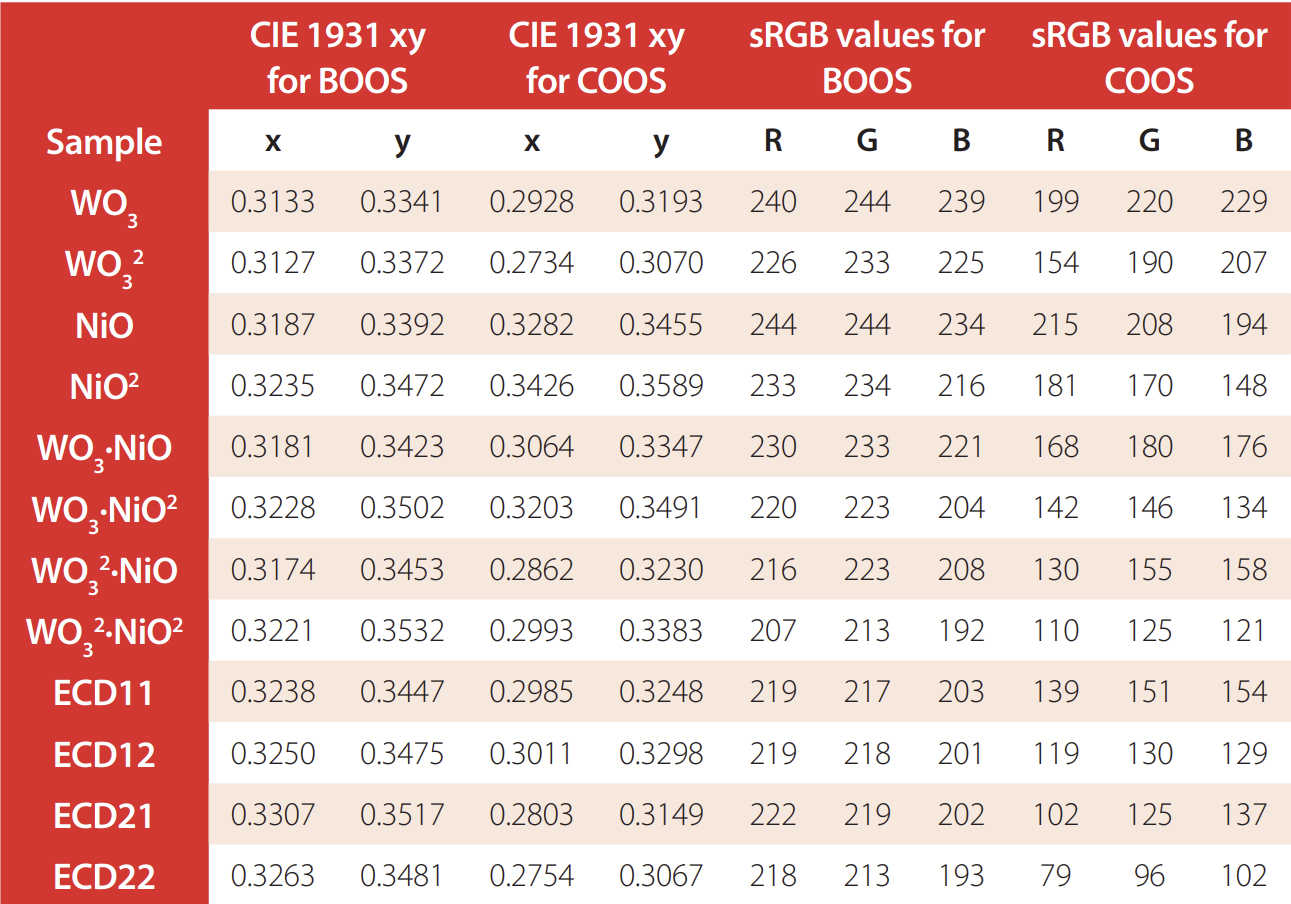
The overall sRGB color distance, defined as the Euclidean distance between the R, G, and B components, yielded the following results: for BOOS, 10.34% (ECD11), 2.31% (ECD12), 3.66% (ECD21), and 4.31% (ECD22); and for COOS, 18.18% (ECD11), 11.12% (ECD12), 18.01% (ECD21), and 18.17% (ECD22). The relatively low color distances obtained for BOOS (< 10%) indicate that the approximation is reasonably accurate when predicting the optical appearance of the devices in their uncolored state (BOOS). The larger deviations observed for COOS suggest that the simplifications—namely, neglecting the optical effects of glass, FTO, electrolyte, and layer R—become less valid when the devices are colored. This occurs because, in COOS, the active layers develop stronger and narrower spectral absorption and scattering features. Small spectral shifts or shape variations thus lead to larger perceptual color differences. Furthermore, nonlinear interactions between layers (e.g., multiple reflections, interference, and interfacial coupling) become more significant when absorption increases, amplifying the discrepancies between the measured and approximated results.
CONCLUSIONS
In this work, the optical constants (OC) and the intrinsic and extrinsic scattering and absorption coefficients (S&A-C) of four WO3–NiO electrochromic devices (ECD) were determined for all combinations of single and double active-layer thicknesses, at both bleached-off (BOOS) and colored-on (COOS) optical states. The study followed a single-layer procedure previously validated for suspended particle devices (SPD) [13] and polymer-dispersed liquid crystals (PDLC) [14, 15]. The OC (n and κ), derived from the collimated–collimated (Tcc and Rcc) equations of the four-flux model (4FM), were used to compute the collimated intermediate parameters (rc and ε), from which the extrinsic and intrinsic S&A-C were subsequently obtained. Extrinsic S&A-C were calculated using the Kubelka–Munk two-flux model (KM-2FM) and the Saunderson correction for interfaces. However, when total transmittance and reflectance measurements (T&R-M) are used instead of diffuse ones, the approximation may become inaccurate for low-haze samples such as ECDs, where total and diffuse T&R-M components differ significantly. Moreover, the diffuse transmittance at longer wavelengths was measured with significant noise due to the absence of a proper light trap (black cone) in the integrating-sphere-based spectrometer, which is typically used to absorb diffuse radiation (i.e., acting as a light sink). In our setup, this component had to be improvised using black sandpaper. Consequently, the noisy diffuse T measurements led to increased uncertainty in the retrieved S and K values at longer wavelengths (>2000 nm). Similarly, intrinsic S&A-C determined from the collimated–diffuse 4FM equations (Tcd and Rcd) are less reliable above 1500 nm, since the same average crossing parameter (ACP) and forward scattering ratio (FSR) are assumed for both forward and backward propagation, and for both collimated and diffuse radiation.
The inverse scattering and absorption problem aims to determine the intrinsic (4FM) and extrinsic (2FM) S&A-C from T&R-M, thereby inferring the size, shape, and composition of the particles responsible for light scattering and absorption [36]. The original differential equations of the 4FM were formulated in [37]. The first analytical 4FM solutions proposed in [19] were complemented by the RT-method (see Introduction), which introduced a fifth equation for the ACP parameter. Later, this RT-method [31, 32] was replaced by the IJ-method [13, 14, 15], which uses forward (i) and backward (j) light intensities instead of T and R. In this study, the IJ-method was applied as the fifth equation required to solve the system of four equations (Tcc, Rcc, Tcd, Rcd) and five unknowns (n, κ, α, ACP, FSR), since β = ε − α. The IJ-method was later extended into the directed-IJ-method [38, 39], introducing two ACP parameters (for forward and backward propagation) and four FSR parameters (for forward/backward and collimated/diffuse radiation). In this case, ACP = 1 + q, i.e., ACPi=1+q0i=1+id0/i0 and ACPj=1+qδj=1+jdδ/jδ.
The present results can be improved in future work by applying the newly developed equations for intrinsic S&A-C from the diffuse differential equations of the 4FM [38] and extrinsic S&A-C from the total differential equations of the 2FM [38, 39]. The new 2FM equations are valid for any haze level, since they are derived by expressing the total differential equations of the 2FM as the sum of the collimated and diffuse differential equations of the 4FM [39] for each propagation direction. These new formulations have already been applied to single-layer studies of SPD and PDLC samples [40, 41], within a three-substrate-layer sandwich structure (TSLSS), and to black coating paints used in solar thermal collectors [42]. That approach enforced a three-extinction matching requirement (3εMR) [38, 39], enabling thickness-gradient plots (TGP) even in samples approximated with fewer layers.
For the present WO3–NiO ECDs, the seven-layer sandwich structure was simplified into a single substrate layer sandwich structure including the front and rear glass substrates, and an internal composite layer that includes the transparent conductor, electrolyte, and WO3/NiO active films. Future work will aim to increase the number of modeled layers to refine these approximations and to implement the directed IJ-method instead of the non-directed version used in the current analysis. A recent study applied the TSLSS configuration and a novel procedure—previously used to enforce the 3εMR in SPD and PDLC samples [43]—to the four inorganic ECDs analyzed in this work [44]. However, it would be more informative to extend this analysis from three to seven layers, allowing separate evaluation of the WO3 and NiO active films while explicitly considering the FTO [8] and electrolyte [38, 39] contributions. For this purpose, the spectral limit of the optical behavior between film and substrate (SLOBFS) is currently under investigation in WO3–FTO–glass and NiO–FTO–glass three-layer samples with three different WO3 thicknesses—single, double, and quadruple. These samples are analyzed only in the BOOS, since for the COOS they must be assembled as complete ECDs. Nevertheless, some insights for the COOS of these WO3–FTO–glass and NiO–FTO–glass configurations may be inferred from Fig. 4 of the present work. The SLOBFS are hypothesized to occur at shorter wavelengths for the interfaces between WO3 and FTO (for both single and double WO3 layers) and between NiO and FTO, corresponding to a transition from substrate–substrate–substrate (SSS) to film–substrate–substrate (FSS) configurations. Subsequently, the SLOBFS between FTO and glass—previously observed at around 1200 nm, approximately three times the FTO layer thickness— would correspond to a transition from FSS to film–film–substrate (FFS) configurations. Finally, for the quadruple WO3 layer, two further transitions, first from SSS to substrate–film–substrate (SFS) configuration (at 1200 nm, corresponding to the SLOBFS of FTO of 400 nm), and then from SFS to FFS configuration (at 1440 nm, corresponding to the SLOBFS of FTO of 400 nm), was preliminarily observed [45].
For future work, the determination of the optical constants and the intrinsic and extrinsic S&A-C of the individual WO3 and NiO electrochromic layers in their bleached and colored optical states (BOOS and COOS) would require new measurements on additional ECD samples. This is necessary because, due to the non-symmetrical sandwich structure (G–FTO–WO3–E–NiO–FTO–G), the optical characterization must be performed in both orientations, i.e., also in the reversed configuration (G–FTO–NiO–E–WO3–FTO–G). As the primary electrochromic material, WO3 can be combined not only with NiO but also with other complementary electrochromic materials [46, 47, 48, 49, 50, 51, 52, 53, 54, 55, 56, 57, 58]. Consequently, the parameters obtained from the three pairs of governing differential equations—namely, the four-flux formulation in the 4FM, which provides the OCs and the intrinsic S&A-C, and the two-flux formulation in the 2FM, which yields the extrinsic S&A-C—can be analyzed not only for the WO3/NiO system, but also for WO3 coupled with other counter-electrode electrochromic materials employed in the fabrication of ECDs. In addition, the 400 nm thick FTO transparent conductive layer used in the present samples could be replaced by layers with different thicknesses or prepared using alternative deposition techniques, or even substituted by ITO or other transparent conductive materials [59, 60, 61, 62, 63, 64, 65, 66]. In addition to the procedure based on the new equations for the intrinsic 4FM and extrinsic 2FM S&A-C described in previous works [38, 39, 40, 41, 42, 43, 44], alternative methodologies could also be implemented in order to compare and validate the results [66 - 108].
ACKNOWLEDGEMENTS
We are grateful to the Laboratory for Spectroscopy of Materials of the National Institute of Chemistry of Ljubljana, Slovenia, for providing the four ECD samples and the measurement equipment (Perkin Elmer Lambda 950 spectrometer), and to the mobility grants of Universidad Carlos III de Madrid for supporting research in Slovenia.
AUTHORS’ CONTRIBUTIONS
David Barrios carried out the measurements and wrote the manuscript; David Barrios and Carlos Alvarez performed 3D figures; David Barrios and Jose Miguitama found the key reference for computing properly the diffuse interface reflectance; David Barrios and Fabrizzio Armando Lopez-Vargas determined the colorimetric results.
AI STATEMENT
No AI tools were used for scientific content generation, data analysis, or interpretation. All scientific results, analysis, and conclusions are the sole responsibility of the authors.
DATA AVAILABILITY STATEMENT
Data are available upon reasonable request to the corresponding author (in exceptional cases).
CONFLICT OF INTEREST
Authors declare that they have no conflicts of interest in this research.
REFERENCES
[1] Granqvist, C. G. (1995). Handbook of Inorganic Electrochromic Materials, Elsevier, Amsterdam. (Figure 1.2, in page 4).
[2] Niklasson, G. A. and Granqvist, C. G. (2007). Electrochromics for smart windows: thin films of tungsten oxide and nickel oxide, and devices based on these. Journal of Materials Chemistry 17(2), 127-56.
[3] Zhang, J., Tu, J.P., Xia, X. H., Qiao, Y. and Lu, Y. (2009). An all-solid-state electrochromic device based on NiO/WO3 complementary structure and solid hybrid polyelectrolyte. Sol. Energy Mater. Sol. Cells, 93, 1840-1845. https://doi.org/10.1016/j.solmat.2009.06.025
[4] Barrios, D. and Alvarez, C. (2023). Spectral voltage contour plots of optical constants and interface parameters of the active layer of a multilayer structure suspended particle device smart window from clear on to dark off states. Orbital: Electron. J. Chem., 15(1), 8-20. https://doi.org/10.17807/orbital.v15i1.16470
[5] Mihelčič, M., Švegl, F., Jerman, I., Orel, B. and Barrios, D. (2012). NiO pigmented coatings and NiO based inorganic EC devices. Innoshade meeting (Paris, 6-2-2012)
[6] Mihelčič, M., Jerman, I. , Švegl, F., Šurca Vuk, A., Slemenik Perše, L., Kovač, J., Orel, B. and Posset, U. (2012). Electrochromic Ni1−xO pigment coatings and plastic film-based Ni1−xO/TiO2 device with transmissive light modulation. Sol. Energy Mater. Sol. Cells, 107, 175-187. https://doi.org/10.1016/j.solmat.2012.08.012
[7] Barrios, D. (2024). Optical constants and thickness gradients for light intensities in glass substrate layers and for complex electric fields in indium tin oxide (ITO) transparent conductor thin film layer, using Bode and Nyquist wavelengthdependent diagrams. J. Phys.: Conf. Ser. 2796, 012019. https://doi.org/10.1088/1742-6596/2796/1/012019
[8] Barrios, D. (2025). Spectral limit of the optical behavior between film and substrate for a fluorine-doped tin oxide (FTO) transparent conductive layer, Journal of Optics and Photonics Research. https://doi.org/10.47852/bonviewJOPR52025408
[9] Born, M., and Wolf, E. (1970). Principles of optics: Electromagnetic theory of propagation, interference and diffraction of light (4th Rev. ed.). UK: Pergamon Press.
[10] Knittel, Z. (1976). Optics of thin films: An optical multilayer theory. UK: Wiley.
[11] Pfrommer P., Lomas K.J., Seale C., and Kupke C. (1995). The radiation transfer through coated and tinted glazing. Solar Energy, 54: 287-299. https://doi.org/10.1016/0038-092X(94)00132-W
[12] Harbecke B. (1986). Coherent and incoherent reflection and transmission of multi-layer structures. Appl. Phys. B39: 165-170. https://doi.org/10.1007/BF00697414
[13] Barrios, D., Alvarez, C., Miguitama, J., Gallego, D. and Niklasson, G.A. (2019). Inversion of two-flux and four-flux radiative transfer models for determining scattering and absorption coefficients for a suspended particle device. Applied Optics, 58 (31), 8871-8881. https://doi.org/10.1364/AO.58.008871
[14] Barrios, D., Alvarez, C., Miguitama, J., Wang, J. and Niklasson, G.A. (2022). Light scattering parameters of polymer dispersed liquid crystals obtained by inversion of experimental data. Conference: Proceedings of the Bremen Zoom Workshop on Light Scattering, ed. by Thomas Wriedt, p. 8-11.
[15] Barrios, D., Alvarez, C., Miguitama, J. and Velez, J. (2024). Inversion of two flux and four flux radiative transfer models for determining scattering and absorption coefficients for polymer dispersed liquid crystals. ACI Avances en Ciencias e Ingenierías, 16(1). https://doi.org/10.18272/aci.v16i1.3146
[16] Kubelka, P. (1948). New contributions to the optics of intensely light-scattering materials. Part I. J. Opt. Soc. Am., 38, 448-457 https://doi.org/10.1364/JOSA.38.000448
[17] Saunderson, J. L. (1942). Calculation of the color of pigmented plastics. J. Opt. Soc. Am., 32, 727–736. https://doi.org/10.1364/JOSA.32.000727
[18] Maheu, B. and Gouesbet, G. (1986). Four-flux models to solve the scattering transfer equation: special cases. Applied Optics, 25, 1122-1128. https://doi.org/10.1364/ao.25.001122
[19] Levinson, R., Berdahl, P., and Akbari, H. (2005). Solar spectral optical properties of pigments– Part I: model for deriving scattering and absorption coefficients from transmittance and reflectance measurements. Sol. Energy Mater. Sol. Cells, 89, 319-349. https://doi.org/10.1016/j.solmat.2004.11.012
[20] Barrios, D., Vergaz, R., Sanchez-Pena, J. M., Granqvist, C. G. and Niklasson, G. A. (2013). Toward a quantitative model for suspended particle devices: optical scattering and absorption coefficients. Sol. Energy Mater. Sol. Cells 111, 115-122. https://doi.org/10.1016/j.solmat.2012.12.012
[21] Barrios, D., Vergaz, R., Sanchez-Pena, J. M., Garcia-Camara, B., Granqvist, C. G. and Niklasson, G. A. (2015). Simulation of the thickness dependence of the optical properties of suspended particle devices. Sol. Energy Mater. Sol. Cells, 143, 613-622. https://doi.org/10.1016/j.solmat.2015.05.044
[22] Kottler, F. (1960). Turbid Media with Plane-Parallel Surfaces. J. Opt. Soc. Am. 50 (5) 483-490. https://doi.org/10.1364/JOSA.50.000483
[23] Kortüm, G. (1969). Reflectance Spectroscopy: Principles, Methods, Applications. Springer, New York, USA. https://doi.org/10.1007/978-3-642-88071-1
[24] Judd, D. B. (1942). Fresnel reflection of diffusely incident light. J. Research NBS, 29, 329-332. https://doi.org/10.6028/jres.029.017
[25] Walsh, J. W. T. (1926). The reflection factor of a polished glass surface for diffused light. Dept. Sci. Ind. Res. (Brit.), Illumination Research Tech. Pap. 2, 10.
[26] Maheu, B., Letoulouzan, J.N., and Gouesbet, G. (1984). Four-flux models to solve the scattering transfer equation in terms of Lorenz–Mie parameters. Applied Optics, 23, 3353-3362. https://doi.org/10.1364/AO.23.003353
[27] Barrios, D. (2016). Radiometry of a suspended particle device smart window. III Congreso Internacional de Ciencia, Tecnología e Innovación para la Sociedad (CITIS), Universidad Politécnica Salesiana, Guayaquil, Ecuador.
[28] Barrios D. and Alvarez, C. (2017). Complex refractive index Snell-Descartes law in four-flux and two-flux models for suspended particle device smart Windows. IV Congreso Internacional de Ciencia, Tecnología e Innovación para la Sociedad (CITIS), Universidad Politécnica Salesiana, Guayaquil, Ecuador.
[29] Barrios, D. (2017). Radiometry based average crossing parameter of four flux model in a suspended particle device. I Congreso Internacional de Ciencias de la Ingeniería (CICI), Universidad Tecnológica Equinoccial, Santo Domingo, Ecuador.
[30] Vargas, W. E. (1999). Two-flux radiative transfer model under nonisotropic propagating diffuse radiation. Applied Optics, 38, 1077-1085. https://doi.org/10.1364/ao.38.001077
[31] Barrios, D., Vergaz, R., Sanchez-Pena, J. M., Mihelcic, M. and Orel, B. (2012). Decoupling scattering and absorption coefficients of internal color active layers of an inorganic WO3 and NiO based electrochromic device at bleached and colored states. IME’10: International Meeting on Electrochromism, Holland - Michigan, USA.
[32] Niklasson, G.A., Wang, J. and Vargas, W.E. (2022). Inversion of light scattering experiments by using the four-flux theory. In Thomas Wriedt (Ed.). Conference: Proceedings of the Bremen Zoom Workshop on Light Scattering, ed. by Thomas Wriedt, p. 40-43. https://scattport.org/index.php/conferences-menu/715-bremen-zoom-workshop-onlight-scattering-2022
[33] Barrios, D. (2012). Characterization and applications of new electrochromic devices: comparison with other electrically controllable transmittance technologies. Ph.D. thesis, Universidad Carlos III de Madrid, Spain.
[34] HunterLab, “XYZ - CIE Tristimulus Values”, Insight on Color 8 (1) 1996
[35] HunterLab, “Yxy CIE Chromaticity Coordinates”, Insight on Color 8 (2) 1996.
[36] Bohren, C. F. & Huffman, D. R. (1983). Absorption and scattering of light by small particles. Wiley.
[37] Beasley, K., Atkins, J. T., and Billmeyer Jr, F. W. (1967). Scattering and absorption of light in turbid media. Electromagnetic Scattering, R. L. Rowell and R. S. Stein, Gordon and Breach, New York.
[38] Barrios, D. (2023). Forward scattering ratios, average crossing parameters and scattering and absorption coefficients new expressions using diffuse differential equations of four flux model. Conference: Proceedings of the Bremen Zoom Workshop on Light Scattering, ed. by Thomas Wriedt, 6-9. https://scattport.org/index.php/programs-menu/multipleparticle-scattering-menu/739-scattering-workshop-2023
[39] Barrios, D. (2024). Intrinsic and extrinsic scattering and absorption coefficients new equations in four-flux and twoflux models used for determining light intensity gradients. Journal of Optics and Photonics Research, 1(3), http://dx.doi.org/10.47852/bonviewJOPR42022261
[40] Barrios, D. (2023). Parameters of differential equations in four-flux models approximated for multilayers samples showing scattering and absorption. XX ELS Electromagnetic and Light Scattering Conference Almuñécar, Spain.
[41] Barrios, D. (2023). Parameters of differential equations in two-flux models approximated for multilayers samples showing scattering and absorption. XX ELS Electromagnetic and Light Scattering Conference Almuñécar, Spain.
[42] Barrios, D. (2024). Parameters of differential equations in four-flux and two-flux models approximated for scattering and absorption results on solar thermal collector black paints. Journal of Physics: Conference Series, 2796, 012018. https://doi.org/10.1088/1742-6596/2796/1/012018
[43] Barrios, D. (2025). New procedure of intrinsic scattering and absorption coefficients in four-flux model for a suspended particle device and a polymer dispersed liquid crystal. Optics Communications, 582, 131594 https://doi.org/10.1016/j.optcom.2025.131594
[44] Barrios, D. (2025). Parameters of differential equations in four-flux and two-flux models approximated for WO3- NiO inorganic electrochromic devices. Journal of Quantitative Spectroscopy and Radiative Transfer. https://doi.org/10.1016/j.jqsrt.2025.109718
[45] Barrios, D. (under review, 2026). Film and substrate spectral optical behaviors of a tungsten trioxide (WO3) thin layer deposited on fluorine-doped tin oxide (FTO) coated glass, Journal of Optics and Photonics Research.
[46] Tan, F., Zhou, J., Guo, Z., Zhang, C., Yu, S., Yang, Y., Xie, Y., Cao, X., Wu, X. and Gao, X. (2025). Research progress on electrochromic properties of WO3 thin films. Coatings, 15(11), 1310. https://doi.org/10.3390/coatings15111310
[47] Mak, A. K., Tuna, Ö., Sezgin, N., Üstün, A. M., Yılmaz, Ş., Öztürk and Karabulut, M. (2022). Effect of Al doping on the electrochromic properties of WO3 thin films. Thin Solid Films, 751, 139241. https://doi.org/10.1016/j.tsf.2022.139241
[48] Krüger, L.U., Cholant, C.M., Rodrigues, M.P., Gomez, J.A., Landarin, D. M., Lucio, C.S., Lopes, D.F., Bulhões, L.O.S. and Avellaneda, C.O. (2022). Photochromism of doped and undoped WO3 sol–gel films. Optical Materials, 128, 112357. https://doi.org/10.1016/j.optmat.2022.112357
[49] Chen, H., Zhang, L., Guo, P., Zhao, M., Chen, Z. and Ma, H. (2023). Enhanced electrochromic and mechanical properties of WO3 film by substrate effect. Surfaces and Interfaces, 41, 103119. https://doi.org/10.1016/j.surfin.2023.103119
[50] Song, K., Weng, S., Zhou, J., Jiang, R., Cao, H. and Zhang, H. (2023). Tunable optical constants of aluminum tungsten bronzes in electrochromic WO3 thin films. Journal of Physical Chemistry C, 127, 18036–18042. https://doi.org/10.1021/acs.jpcc.3c03521
[51] Zehra Nur Ozer, Mehmet Ozkan, Suat Pat. (2024). Investigation of the microstructural, surface, and optical properties of WO3-doped ZnO thin films. Inorganic Chemistry Communications, 170, Part 1, 113301. https://doi.org/10.1016/j.inoche.2024.113301
[52] Zheng, J.Y., Sun, Q., Yang, H., Yu, S., Li, M., Yu, X., Wang, C., Liu, T. and Li, S. (2024). Amorphous bismuth and GO codoped WO3 electrochromic film with fast-switching time and long-term stability. Dalton Transactions, 53(6):2460- 2464. https://doi.org/10.1039/D3DT03805J
[53] Wang, Z., Liu, G., Li, C., Qiao, M., Tian, M., Lin, X., Cui, W., Wang, X., Liu, J., and Xu, S. (2025). W/WO3/TiO2 Multilayer film with elevated electrochromic and capacitive properties. Materials, 18(1), 161. https://doi.org/10.3390/ma18010161
[54] Nakrela, A., Nehal, M. ElF., Bouzidi, A., Miloua, R., Medles, M., Khadraoui, M. and Desfeux, R. (2025). Comprehensive investigation of WO3₋ₓ thin films: structural, optical, and electrical insights. Ceramics International, 51, 16997–17006. https://doi.org/10.1016/j.ceramint.2025.02.009
[55] Nie, S., Lian, Y., Han, H., Zhao, L. and Liu, Z. (2025). Efficient Electrochromic Electrode Materials Based on WO3/ Ni(OH)2 with Dual Ion Implantation Modulability and Energy Level Matching. Advanced Materials Technologies, 10(9), 2401295. https://doi.org/10.1002/admt.202401295
[56] Kwon, S. J., Rajesh, J. A., Kang, S. H. and Ahn, K. S. (2026). Electrochemical and optical characterization of WO3 films synthesized by pulse current method and their application in electrochromic devices. Electrochimica Acta, 549, 148076. https://doi.org/10.1016/j.electacta.2025.148076
[57] Sharma, R., Nihal, Sharma, M., and Goswamy, J.K. (2026). Investigation of electrochromic properties of MoSe2/WO3 nanocomposite. (2026). Materials Letters, 406, 139968. https://doi.org/10.1016/j.matlet.2025.139968
[58] Adnan, M., Jamil, M., Ramzan, B., Hussain, T., Afaq, A. and Ghani, M. (2024). Determination of the optical properties of tungsten trioxide thin film using the transfer matrix method. Indian Journal of Physics, 99(5), 1645–1649. https://doi.org/10.1039/D3DT03805J
[59] Ramírez-Amador, R., Alvarado-Pulido, J. J., Martínez-Hernández, H. P., Cortes-Maldonado, R., Alcántara-Iniesta, S., Flores-Carrasco, G., Ojeda-Durán, E., Malik, O., Morales-de la Garza, L. and Méndez-Rojas, M. A. (2023). Study of fluorine-doped tin oxide thin films deposited by pneumatic spray pyrolysis and ultrasonic spray pyrolysis: A direct comparison. Materials Research Express, 10(6), 066402. https://doi.org/10.1088/2053-1591/acda1a
[60] Thomas, R., Mathavan, T., Ganesh, V., Yahia, I. S., Zahran, H. Y., AlFiafy, S., and Kathalingam, A. (2020). Investigation of erbium co-doping on fluorine doped tin oxide via nebulizer spray pyrolysis for optoelectronic applications. Optical and Quantum Electronics, 52(5), 248. https://doi.org/10.1007/s11082-020-02376-8
[61] Isoe, W. M., Mageto, M. J., Maghanga, C. M., Mwamburi, M. M., and Odari, B. V. (2023). Optical modelling of TCO based FTO/TiO2 multilayer thin films and simulation in hydrogenated amorphous silicon solar cell. Scientific African, 20, e01678. https://doi.org/10.1016/j.sciaf.2023.e01678
[62] Toral-López, A., Pérez, M. M., Rodríguez-Águila, A. B., Cardona, J. C., Ionescu, A. M., and Godoy, A. (2023). Investigation of the optical properties of indium tin oxide thin films by double integration sphere combined with the numerical IAD method. Materials, 16(4), 1425. https://doi.org/10.3390/ma16041425
[63] Shklyaev, A. A., Utkin, D. E., Zheng, Z., and Tsarev, A. V. (2023). Redirecting incident light with Mie resonance-based coatings. Photonics, 10(11), 1286. https://doi.org/10.3390/photonics10111286
[64] Stenzel, O. and Wilbrandt, S. (2025). Theoretical aspects of thin film optical spectra: Underlying models, model restrictions and inadequacies, algorithms, and challenges. Applied Sciences, 15(4), 2187. https://doi.org/10.3390/app15042187
[65] Dvořák, J., Vohánka, J., Buršíková, V., Franta, D. and Ohlídal, I. (2023). Optical characterization of inhomogeneous thin films deposited onto non-absorbing substrates. Coatings, 13(5), 873–889. https://doi.org/10.3390/coatings13050873
[66] Nosidlak, N., Jaglarz, J., Vallati, A., Dulian, P., Jurzecka-Szymacha, M., Gierałtowska, S., Seweryn, A., Wachnicki, Ł., Witkowski, B. S. and Godlewski, M. (2023). The Optical Properties of Thin Film Alloys of ZnO, TiO2 and ZrO2 with Al2O3 Synthesised Using Atomic Layer Deposition. Coatings, 13, 1872. https://doi.org/10.3390/coatings13111872
[67] Egorov, N. V., Fedorov, A. G. and Trofimov, V. V. (2024). Metody matrits perenosa i rasseyaniya dlya chislennogo opredeleniya koeffitsiyentov otrazheniya i prelomleniya tonkoplenochnykh materialov [Comparison transfer matrix methods and scattering matrix method for investigation the optical properties of multilayer structures]. Vestnik of Saint Petersburg University. Applied Mathematics. Computer Science. Control Processes, 20(4), 432–445. https://doi.org/10.21638/spbu10.2024.401
[68] Ren, Y., Kong, D., Tan, W., Wang, J., Chen, T., Zhang, Q. and Xia, W. (2024). Simultaneous determination of the scattering and absorption coefficients of turbid media based on Mueller matrix. Journal of Modern Optics, 71(10–12), 354–363. https://doi.org/10.1080/09500340.2024.2422905
[69] Taylor A, Parkin I, Noor N, Tummeltshammer C, Brown M. S., and Papakonstantinou I. (2013). A bioinspired solution for spectrally selective thermochromic VO2 coated intelligent glazing. Optic Express, 21(S5):A750–64. https://doi.org/10.1364/OE.21.00A750
[70] Oreski G, Tscharnuter D, Wallner G. M. (2010) Determination of solar optical properties of transparent polymer films using UV/vis spectroscopy. Solar Energy Materials and Solar Cells 94(5), 884–91. https://doi.org/10.1016/j.solmat.2010.01.012
[71] Hébert, M. and Machizaud, J. (2012). Spectral reflectance and transmittance of stacks of nonscattering films printed with halftone colors. Journal of the Optical Society of America A, 29(11), 2498–508. https://doi.org/10.1364/JOSAA.29.002498
[72] Kolokotsa, D.D., Dimitriou, V. and Synnefa, A. (2013). Modeling cool materials’ Properties. Advances in the development of cool materials for the built environment, 195–230. https://doi.org/10.2174/97816080547181130101
[73] Bayou, S., Mouzali, M., Aloui, F., Lecamp, L. and Lebaudy, P. (2013).Simulation of conversion profiles inside a thick dental material photopolymerized in the presence of nanofillers. Polymer Journal, 45, 863–70. https://doi.org/10.1038/pj.2012.226
[74] Clark, N., Vargas, W. E., Azofeifa, D.E., Sáenz-Arce, G., Solís, H. and Ramírez-Hidalgo, G. (2014). Polycrystalline indium films in the percolation threshold regime: time correlation between electric conduction and optical properties with film morphology. Materials Research Express, 1(1), 016302. https://doi.org/10.1088/2053-1591/1/1/016302
[75] Mazauric, S., Hébert, M., Simonot, L. and Fournel, T. (2014). Two-flux transfer matrix model for predicting the reflectance and transmittance of duplex halftone prints. Journal of the Optical Society of America A, 31(12), 2775–88. https://doi.org/10.1364/JOSAA.31.002775
[76] Wang, L., Eldridge, J.I. and Guo, S. M. (2014). Comparison of different models for the determination of the absorption and scattering coefficients of thermal barrier coatings. Acta Materialia, 64, 402–10. https://doi.org/10.1016/j.actamat.2013.10.053
[77] Laaksonen, K., Li, S.Y., Puisto, S.R., Rostedt, N.K.J., Ala-Nissila, T., Granqvist, C.G., Nieminen, R.M. and Niklasson, G.A. (2014). Nanoparticles of TiO2 and VO2 in dielectric media: conditions for low optical scattering, and comparison between effective medium and four-flux theories. Solar Energy Materials and Solar Cells, 130, 132–7. https://doi.org/10.1016/j.solmat.2014.06.036
[78] Hébert, M., Simonot, L. & Mazauric, S. (2015). Matrix method to predict the spectral reflectance of stratified surfaces including thick layers and thin films. 〈hal-01155614〉.
[79] Hébert, M. and Emmel, P. (2015). Two-flux and multiflux matrix models for colored surfaces. In: Kriss Mickael, editor. Handbook of digital imaging, 31. John Wiley & Sons 1233–77. https://doi.org/10.1002/9781118798706.hdi055
[80] Van Song, T. P., Andraud, C. and Ortiz-Segovia, M.V. (2016). Towards spectral prediction of 2.5D prints for soft-proofing applications. Sixth International Conference on Image Processing Theory, Tools and Applications (IPTA), 1–6. https://doi.org/10.1109/IPTA.2016.7820957
[81] Van Song, T. P., Andraud, C. and Ortiz-Segovia, M.V. (2016). Implementation of the four-flux model for spectral and color prediction of 2.5D prints. Proceedings IS&T Printing for Fabrication: Int’l Conf. on Digital Printing Technologies (NIP32). https://doi.org/10.2352/ISSN.2169-4451.2017.32.26
[82] Hébert, M., Mazauric, S. and Simonot, L. (2016). Assessing the capacity of two-flux models to predict the spectral properties of layered materials. Proceedings IS&T Int’l. Symp. on Electronic Imaging: Measuring, Modeling, and Reproducing Material Appearance. https://doi.org/10.2352/ISSN.2470-1173.2016.9.MMRMA-369
[83] Simonot, L., Hersch, R. D., Hébert, M. and Mazauric, S. (2016). Multilayer four-flux matrix model accounting for directional-diffuse light transfers. Applied Optics, 55(1), 27–37. https://doi.org/10.1364/AO.55.000027
[84] Van Song, T. P., Andraud, C. and Ortiz-Segovia, M.V. (2017). Spectral predictions of rough ink layers using a four-flux model. Color Imaging Conference, 25, 251–7. https://doi.org/10.2352/ISSN.2169-2629.2017.25.251
[85] Gueye, E. H. O., Tall, P. D, Talla, K., Dione, A. N., Dioum, A., Gaye, M. B., Ndiaye, N. M., Ngom, B. D. and Beye, A.C. (2017). Optical and electrical modeling of dye sensitized solar cell: influence of the overlap distance between TiO2 particles. American Journal of Modern Physics, 6 (1), 1–9. https://doi.org/10.11648/j.ajmp.20170601.11
[86] Tonon, C., Rozé, C., Girasole, T. and Duvignacq, C. (2017). Multilayer four-flux model for the optical degradation of thermal control coatings in space. Proceedings 10569, International Conference on Space Optics — ICSO 2000, 105691F. https://doi.org/10.1117/12.2307931
[87] Simonot, L., Hébert, M., Mazauric, S. and Hersch, R. D. (2017). Assessing the proper color of translucent materials by an extended two-flux model from measurements based on an integrating sphere. Proceedings IS&T Int’l Symp. on Electronic Imaging: Material Appearance, 48–56. https://doi.org/10.2352/ISSN.2470-1173.2017.8.MAAP-291
[88] Slovick, B., Flom, Z., Zipp, L. and Krishnamurthy, S. (2017). Transfer matrix method for four-flux radiative transfer. Applied Optics, 56(21), 5890–6. https://doi.org/10.1364/AO.56.005890
[89] Genty-Vincent, A., Van Song, T. P., Andraud, C. and Menu, M. (2017). Four-flux model of the light scattering in porous varnish and paint layers: towards understanding the visual appearance of altered blanched easel oil paintings. Applied Physics A, 123:473. https://doi.org/10.1007/s00339-017-1092-1
[90] Gali, M. A., Gentle, A, R., Arnold, M. D. and Smith, G. B. (2017). Extending the applicability of the four-flux radiative transfer method. Applied Optics, 56(31), 8699–709. https://doi.org/10.1364/AO.56.008699
[91] Shilpi Shital, S., Barnes, P. R. F. and Dutta, V. (2018). Analysis of four-flux parameters of TiO2 films commonly used in DSSCs. Solar Energy, 173:530–8. https://doi.org/10.1016/j.solener.2018.07.095
[92] De la Hoz, E., Alcaraz de la Osa, R., Ortiz, D., Saiz, J. M., Moreno, F. and González, F. (2019). Physically meaningful Monte Carlo approach to the four-flux solution of a dense multilayered system. Journal of the Optical Society of America A, 36(2), 292–304. https://doi.org/10.1364/JOSAA.36.000292
[93] Duveiller, V., Gevaux, L., Clerc, R., Salomon, J. P. and Hebert, M. (2020). Reflectance and transmittance of flowable dental resin composite predicted by the two-flux model: on the importance of analyzing the effective measurement geometry. Proceedings IS&T 28th Color and Imaging Conference, 313–20. https://doi.org/10.2352/issn.2169-2629.2020.28.50
[94] Eymard, J., Clerc, R., Duveiller, V., Commault, B. and Hébert, M. (2022). Characterization of UV–Vis–NIR optical constants of encapsulant for accurate determination of absorption and backscattering losses in photovoltaics modules. Solar Energy Materials and Solar Cells, 240(15), 111717. https://doi.org/10.1016/j.solmat.2022.111717
[95] Huang, Z., Long, L., Ye, H. and Liu, M. (2023). A modified Kubelka− Munk four− flux model for UV− vis− NIR spectral reflectance of a particle− inclusion film. Proceedings of the 10th International Symposium on Radiative Transfer, RAD23, 415–22. https://doi.org/10.1615/RAD-23.610
[96] Mishra, B. R., Varghese, N. J. and Sasihithlu, K. (2023). Semi-analytical technique for the design of disordered coatings with tailored optical properties. Optic Express, 31(6), 10201–16. https://doi.org/10.1364/OE.484308
[97] Duveiller, V., Clerc, R., Eymard, J., Salomon, J. P. and Hébert, M. (2023). Performance of two-flux and four-flux models for predicting the spectral reflectance and transmittance factors of flowable dental resin composites. Dental Materials, 39(8), 743–55. https://doi.org/10.1016/j.dental.2023.06.010
[98] Gouesbet, G. (2024). T-matrix methods for electromagnetic structured beams: a commented reference database for the period 2019–2023. Journal of Quantitative Spectroscopy and Radiative Transfer, 322:109015. https://doi.org/10.1016/j.jqsrt.2024.109015
[99] Gautheron, A., Clerc, R., Duveiller, V., Simonot, L., Montcel, B. and Hébert, M. (2024). On the validity of two-flux and four-flux models for light scattering in translucent layers: angular distribution of internally reflected light at the interfaces. Optic Express 32(6), 9042–60. https://doi.org/10.1364/OE.510888
[100]Song, X., Li, H., Gong, H., Liu, X., Zhang, M., Wang, Z., Zhou,X., Zhao, Q. and Fan, T. (2025). Machine learning prediction framework for tailoring the optical response of particulate media. ACS Photonics, 12(5), 2775–86. https://doi.org/10.1021/acsphotonics.5c00364
[101]Bilokur, M. and Jonsson, J. C. (2025). Comparing optical four-flux model results with experimental data obtained by integrating sphere measurements. Applied Optics, 64(8), 1918–23. https://doi.org/10.1364/AO.558629
[102]Vargas, W. E., Wang, J. and Niklasson, G. A. (2021). Effective backscattering and absorption coefficients of light diffusing materials retrieved from reflectance and transmittance spectra of diffuse radiation. Journal of Modern Optics, 68(12), 605–23. https://doi.org/10.1080/09500340.2021.1936244
[103]Vargas, W. E., Wang, J. and Niklasson, G. A. (2020). Scattering and absorption cross sections of light diffusing materials retrieved from reflectance and transmittance spectra of collimated radiation. Journal of Modern Optics, 67(11), 974– 91. https://doi.org/10.1080/09500340.2020.1801872
[104]Niklasson, G.A., Wang, J., Notfors, C., Niklasson, S.L., Strømme, M. and Århammar, C. Light scattering parameters by inversion of experimental data: the case of sunscreen lotions. (2021). Wriedt Thomas, Eremin Yuri, editors. Conference: Proceedings of the Bremen Zoom Workshop on Light Scattering, 16–9.
[105]Wang, J. and Niklasson, G. A. (2021). Extraction of light absorption and scattering coefficients of gold nanocomposites. Wriedt Thomas, Eremin Yuri, editors. Conference: Proceedings of the Bremen Zoom Workshop on Light Scattering, 25–8.
[106]Vargas, W. E. (2026). Effect of concentration, lumpiness, aggregation, and cluster compaction on optical properties of particulate media. Optics Continuum, 5(1), 210-234. https://doi.org/10.1364/OPTCON.582538
[107]Vargas, W. E. (2026). Synthetic reflectance and transmittance spectra of particulate materials evaluated from four-flux radiative transfer models. Optics Continuum, 4 (9), 2130-2153. https://doi.org/10.1364/OPTCON.569131
[108]Vargas, W. E. Abarca-Quesada, D. A., Wang, J. and Niklasson, G. A. (2024). Determination of intrinsic scattering and absorption coefficients of light diffusing materials: application of a spectral projected gradient method. Journal of Modern Optics, 71, 640-664. https://doi.org/10.1080/09500340.2024.2448213
APPENDIX: NOMENCLATURE
Greek symbols
α intrinsic scattering coefficients
β intrinsic absorption coefficients
δ z coordinate at front interface
ε extinction coefficient
κ imaginary part of refractive index
λ wavelength
θc critical angle for total internal reflection
ω interface reflectance
English symbols
0 z coordinate at back interface
2FM two-flux model
3εMR three extinction matching requirement
4FM four-flux mode
ACP average crossing parameter
BOOS bleached-off optical state
COOS colored-on optical state
cc collimated-collimated
cd collimated-diffuse
ECD electrochromic device
FSR forward scattering ratio
fb feedback
FSS film-substrate-substrate
FFS film-film-substrate
FTO fluorine-doped tin oxide
forward light flux
forward light flux at the front interface
collimated forward light flux
collimated forward light flux at the back interface
collimated forward light flux at the front interface
diffuse forward light flux at the back interface
diffuse forward light flux at the front interface
ITO tin-doped indium oxide
IJ forward light flux-backward light flux
j backward light flux
backward light flux at the back interface
backward light flux at the front interface
collimated backward light flux at the front interface
collimated backward light flux at the back interface
collimated backward light flux at the back interface
diffuse backward light flux at the back interface
diffuse backward light flux at the front interface
K extrinsic absorption coefficient
KM Kubelka-Munk
MLG Maheu-Letoulozan-Gouesbet
n real part of refractive index
ñ complex refractive index
NiO nickel oxide
OC optical constants
PDLC polymer dispersed liquid crystal
PDLC polymer dispersed liquid crystal
q diffuse fraction of light
diffuse fraction of the forward light at the back interface
diffuse fraction of backward light at the front interface
R reflectance
reflectance at the bleached-off optical state
reflectance at the colored-on optical state
collimated interface reflectance
diffuse interface reflectance
external diffuse interface reflectance
internal diffuse interface reflectance
measured specular reflectance
calculated specular reflectance
measured diffuse reflectance
calculated diffuse reflectance
calculated total reflectance
measured total reflectance
RT reflectance-transmittance
S extrinsic scattering coefficient
SFS substrate-film-substrate
SSS substrate-substrate-substrate
SWR solar wavelength range
SLOBFS spectral limit of the optical behavior between film and substrate
S&A-C scattering and absorption coefficients
SPD suspended particle device
T transmittance
transmittance at the bleached-off optical state
transmittance at the colored-on optical state
calculated specular transmittance
Tcc calculated specular transmittance
calculated diffuse transmittance
measured diffuse transmittance
calculated total transmittance
measured total transmittance
TGP thickness gradient plots
TSLSS three-substrate layer sandwich structure
VWR visible wavelength range
tungsten oxide
Notas de autor
dbarriosp76@gmail.com
Información adicional
redalyc-journal-id: 7261