SECCIÓN A: CIENCIAS EXACTAS Y FÍSICAS
Inversión de los modelos de transferencia radiativa de dos flujos y de cuatro flujos para determinar los coeficientes de dispersión y de absorción para cristales líquidos dispersos en polímero
Inversión de los modelos de transferencia radiativa de dos flujos y de cuatro flujos para determinar los coeficientes de dispersión y de absorción para cristales líquidos dispersos en polímero
Avances en Ciencias e Ingenierías, vol. 16, núm. 1, e3165, 2024
Universidad San Francisco de Quito
Recepción: 28 Noviembre 2023
Aprobación: 28 Febrero 2024
Resumen: Los coeficientes intrínsecos y extrínsecos de dispersión y absorción de ocho muestras de cristales líquidos dispersos en polímero no absorbedoras de luz, con dos diferentes tamaños del área activa y con cuatro diferentes espesores de la capa interna activa, en sus estados de apariencia óptica translucidos apagados y transparentes encendidos –sin y con voltaje eléctrico aplicado, respectivamente– fueron satisfactoriamente determinados siguiendo el mismo procedimiento descrito en trabajos anteriorescon un dispositivo de partículas suspendidas –una muestra de ventana inteligente absorbedora de luz– y con otra muestra de ventana inteligente de cristales líquidos dispersos en polímero. Este procedimiento, basado en los modelos de transferencia radiativa de dos flujos y de cuatro flujos, considera el ángulo crítico de reflectancia interna total para determinar la reflectancia difusa interna de interface, y utiliza la misma ecuación propuesta previamente para el parámetro de camino promedio, basada en las intensidades difusas y totales de los haces de luz hacia adelante y hacia atrás, para resolver el modelo de cuatro flujos, a fin de determinar los coeficientes intrínsecos. La apariencia óptica simulada resultó ser un estado apagado translucido blanco lechoso y un estado encendido transparente incoloro, el cuál llega a ser más transparente para las muestras de cristales líquidos dispersos en polímero con espesores más finos, requiriendo mayor voltaje aplicado para los estados ópticos encendidos transparentes de las muestras caracterizadas de cristales líquidos dispersos en polímero.
Palabras clave: parámetro de camino promedio, modelo de cuatro flujos, modelo de dos flujos, coeficientes de dispersión y de absorción, cristales líquidos dispersos en polímero.
Abstract: Intrinsic and extrinsic scattering and absorption coefficients of eight non-absorbing light polymer dispersed liquid crystals samples, with two different sizes of the active area and with four different thicknesses of the internal active layer, at their translucent off and at their transparent on optical appearance states–without and with applied electrical voltage, respectively–were successfully determined following the same procedure described in previous works with a suspended particle device−a light absorbing smart window sample−and with another commercial polymer dispersed liquid crystals smart window sample. This procedure, based on two-flux and four-flux radiative transfer models, considers the critical angle of total internal reflection for determining the internal diffuse interface reflectance and uses the same previously proposed equation for average crossing parameter, based on diffuse and total intensities of forward and backward light beams, for solving the four-flux model in order to determine intrinsic coefficients. Simulated optical appearance resulted in a milky white translucent off state and a colorless-transparent on state that becomes more transparent for polymer dispersed liquid crystals samples with thinner thicknesses, requiring higher applied voltage for the transparent on optical states of the thicker polymer dispersed liquid crystals samples characterized.
Keywords: average crossing parameter, four-flux model, two-flux model, scattering and absorption coefficients, polymer dispersed liquid crystals.
INTRODUCTION
Polymer dispersed liquid crystals (PDLC) are included within the electrically controllable chromogenic technologies, since the amount of light that passes through them can be controlled by external electric stimulation. The main application of PDLC such as smart window shows two different optical states−transparent on and translucent off− depending on the light to be transmitted through direct or diffuse, with and without applied AC voltage signal, respectively [1,2,3]. In this technology, PDLCs consist of a thin polymeric matrix layer containing liquid crystal micro drops. This mixture is placed over two transparent substrates covered with a conductive layer, usually indium tin oxide (ITO). In this work an electro-optical characterization of eight different samples of these devices fabricated on glass substrates, with different thicknesses and sizes, was carried out following the same procedure used in previous works with a suspended particle device (SPD) sample [4] and with another commercial PDLC sample [5]. The purpose of the electro-optical characterization carried out is to obtain the optical constants and the scattering and absorption coefficients of the PDLC samples, useful parameters required in order to predict the optimum thickness of the samples and the required voltage applied so the transmittance contrast is improved. Optical constants are also known as complex refractive index, i.e., the real part standing for the speed of light at the inner of the samples and the imaginary part related to the extinction of light, which is caused either by scattering or by absorption of light. The procedure consists of three steps. In the first step, optical constants (n and κ) were obtained from collimated- collimated (cc) transmittance and reflectance (T & R) equations of Maheu, Letoulozan and Gouesbet four-flux model (MLG-4FM, [6]) by fitting to the measured collimated- collimated T & R components, i.e., regular transmittance (Treg) and specular reflectance(Rspe), for the eight PDLC samples at translucent off and transparent on states, with andwithout an applied voltage signal, respectively. In the second step, extrinsic scatteringand absorption coefficients (S and K, respectively) were obtained from Kubelka-Munk two flux model (KM-2FM, [7]), followed by the Saunderson correction [8]−in order to take the interfaces into account−by fitting to measured total T & R components (Ttot andRtot). Finally, in the third step, intrinsic scattering and absorption coefficients (α and β, respectively) were obtained from collimated-diffuse (cd) T & R equations of MLG-4FM [6]. As in previous works with the SPD and the commercial PDLC samples [4,5], the previously proposed equation for average crossing parameter (ACP) was used for decoupling extinction coefficients (ε) into intrinsic scattering and absorption coefficients (ε=α+β), by fitting forward scattering ratio (FSR) and α (being β=ε−α) to the measured diffuse T & R components (Tdif and Rdif ), using the collimated-diffuse (cd) T & R equations of MLG- 4FM [6]. Here, ε was determined using real and imaginary parts of refractive index (n and κ) and wavelength (λ), i.e., ε=4πκ/λn=4πκn/λ (since λn=λ/n due to compression of light wavelength inside of the samples with respect to outside air).
For obtaining both extrinsic and intrinsic coefficients, the internal diffuse interface reflectance (r i) was computed using the method described by Kortum [9], i.e., integrating Fresnel reflection coefficients, for S and P light polarizations. However, the upper limit of integration used was the critical angle of total internal reflection (θc), instead of up to 90º, i.e., in the complete forward hemisphere, leading to the same value as for external diffuse interface reflectance (r e), such as Mac Adam suggested to Kottler [10]. In this way, instead of different external and internal diffuse interface reflectance (r i and r e), as Juddd d[11] and Walsh [12] procedures obtained, the same value for both external and internaldiffuse interface reflectances are obtained for diffuse light beams (r i=r e=r ), as it alsod d dtakes place with collimated interface reflectances (r i=r e=r ). For instance, at an air-glassc c cinterface (with optical constants of glass nG≈1.5 and κG≈0), rc≈0.04 and rd≈0.09 (valuesof r i≈0.60 and r e≈0.09 are obtained if integrating up to 90° instead of up to θ [11,12]). Asd d cdescribed in [4], before considering Mac Adam to Kottler’s suggestion [10], the results of KM-2FM applied to the SPD sample obtained some fitting mistakes at the visible range for Rtot [13,14]. For obtaining extrinsic S and K coefficients, total interface reflectance (ω)at back interface (at z=0) for forward light beam (i) and at front interface (at z=δ) for0backward light beam (j) were calculated as required intermediate parameters (ω i and ω j) by means of diffuse fractions of light (q), as explained by Levinson [15], i.e., ω=r ·(1-δ cq)+rd·q. Hence, despite the fact that KM-2FM [7] was in principle a model used with samples showing only diffuse light, Levinson [15] suggested that it can be used, in anapproximated way, for samples showing total light, i.e., collimated and diffuse light, instead of only diffuse [15]. The equations for q i and q j obtained in previous works [13]0 δwere used for computing ω i and ω j parameters. Since at the measurement process the0 δsamples are illuminated only with collimated light beam through the front interface,q i=0 or iδ=i δ=1 and j0=i δ=0 (being q j not required since the sample j0=j 0+j 0=0).δ c d 0 c dBesides, feedback ACP and FSR parameters were obtained using Vargas’s relations [16] in order to validate the applicability of KM-2FM [7] with Saunderson correction [8] for non- absorbing light samples, such as PDLCs. The optical measurements of the eight PDLC samples were carried out in a previous work of the authors, where an equivalent electric circuit was proposed using electrochemical impedance spectroscopy from Bode and Nyquist impedance diagrams [17].
MATERIALS AND METHODS
The amount and spectrum of light crossing the LC is controlled using its molecular axis orientation to turn the polarization of the incoming light. By changing the orientationof the LC molecules placed between two conductive electrodes with the electric field, it is possible to vary the intensity of transmitted light, as is the case of switchable devices based on LC. A PDLC consists of microscopic nematic LC spheres, known as droplets, dispersed in a polymer matrix (Fig. 1). These droplets scatter incoming light resulting in a milky white appearance. LC molecules are oriented allowing light transmission instead of scattering when applying an AC voltage signal.
Eight PDLC samples over glass substrate were developed by Cidetec S.A. with two different active areas (PDLC-A samples with 3 x 2.7 cm2 and PDLC-B samples with 3.3 x 1.8 cm2) and four different internal active layer thicknesses (25, 50, 75 and 100 μm), following a manufacture procedure described in [18,19]. Fig. 2 shows a photograph of the PDLC 25-A sample at both translucent off and transparent on optical states. A 24 Vrms 50 Hz sinusoidal voltage signal was used for switching the PDLC samples from translucent off to transparent on states. The optical measurements were carried out using a Perkin Elmer Lambda 900 spectrometer equipped with an integrating sphere used to collect diffuse components of transmitted and reflected light. Total and diffuse T & R components (Ttot, Rtot, Tdif and Rdif ) were measured in the solar wavelength range, from 250 to 2500 nm, with 5 nm steps. Collimated T & R components (Treg and Rspe) were obtained subtracting diffuse to total measured T & R components.
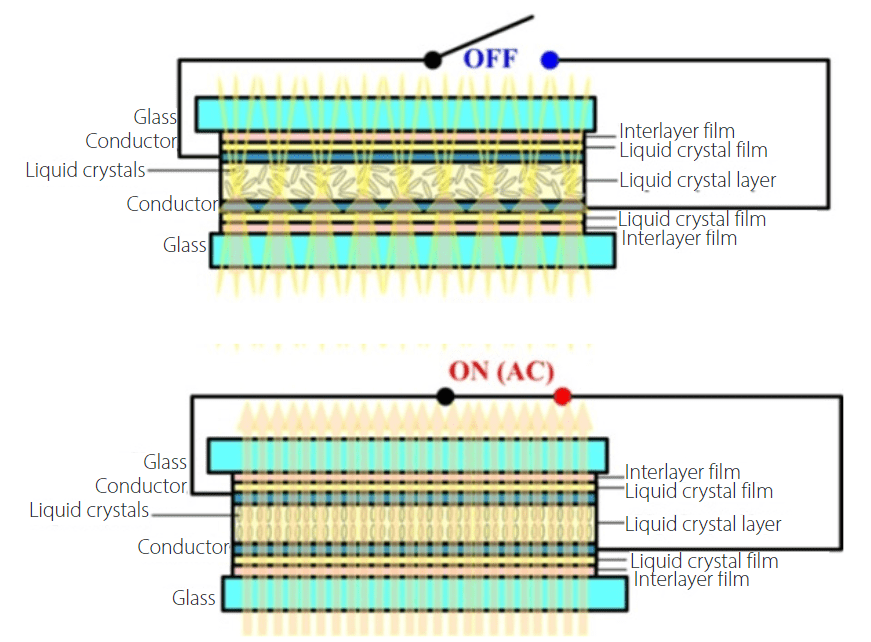
FIGURE 1
Sandwich structure and principle of operation of a polymer dispersed liquid crystal (PDLC) smart window at translucent off (above) and transparent on (below) optical states.
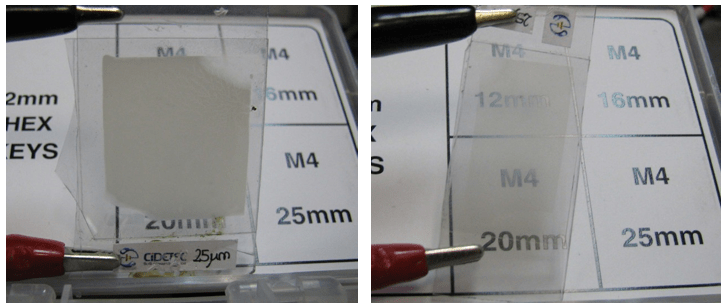
FIGURE 2
Photograph of PDLC 25-A sample at translucent off (left) and transparent on (right) optical states
RESULTS
The same method described in previous works for an SPD sample [4], at both dark off and clear on optical states, and for a commercial PDLC sample [5], at both translucent off and transparent on optical states, is used in this work for the eight PDLC samples characterized, of two different active areas (A and B) and four different thicknesses of the inner active layer (25, 50, 75 and 100 μm), at both translucent off and transparent on states. The procedure carried out for optical characterization was described in the introduction section. Optical constants are obtained in the first step from fitting measured direct T & R components to cc eq. of MLG-4FM [6] and used to determine collimated interface reflectance rc and lightextinction coefficients ε. Then, extrinsic scattering and absorption coefficients (S and K) areobtained from fitting measured total T & R components using KM-2FM [7] with Saunderson correction [8] in the second step. The third step consists of obtaining intrinsic scattering and absorption coefficients (α and β) and FSR parameter from fitting measured diffuse T & R components to cd eq. of MLG-4FM [6] by using the fifth eq. proposed for ACP parameter. Finally, ACP and FSR obtained parameters are related using feedback Vargas’s relations [16] by comparison of the intrinsic and extrinsic coefficients
Collimated Interface Reflectance and Extinction from 4FM Collimated- Collimated Measurements
For the eight PDLC samples, rc and ε were determined using MLG-4FM [6] cc equations by fitting calculated collimated-collimated transmittance and reflectance (Tcc and Rcc)−i.e., collimated components measured when illuminating with collimated light−to the measured direct components Treg and Rspe. Collimated T & R measurements and fittings of the PDLC 25-A sample, at translucent off and transparent on states, are detailed in Fig. 3. A perfect fitting is achieved for both optical appearances, showing a much higher contrast in Treg than in Rspe. The oscillations observed at infrared range of wavelength only for the transparent on state for Treg and Rspe are considered as interference effects [21]. These oscillations were also observed at the clear on state of the previously characterized SPD sample [4] and at the transparent on state of the previously characterized commercial PDLC sample [5].
Fittings and measurements of Treg and Rspe of A and B PDLC samples in Fig. 4 show that the main contrasts between translucent off and transparent on states is observed with Treg for the thinner devices, i.e., PDLC 25-A and PDLC 25-B samples. Contrasts decrease for thicker devices with the applied voltage of 24 Vrms 50 Hz sinusoidal signal. This is because the amount of voltage required for switch PDLC samples depends on the thickness, usually being around 2 to 10 V/μm. It should be expected that a higher amplitude voltage applied to thicker PDLC samples would result in a higher transparency for the transparent on state, as well as interference effects oscillations, which are only observed for the thinner PDLC samples at transparent on states, with the applied amplitude of 24 Vrms in a sinusoidalvoltage signal. Besides, contour plots of Fig. 5 evidence the dependency of the thickness with the spectral Treg, observing the same behavior of PDLC samples at both translucent off and transparent on states. However, the PDLC thickness shows independency for Rspe, due to the almost vertical fringes of contour plots for both A and B PDLC samples.
The total interface reflectance at front interface for forward light sense (ω i) is r due to q i=0,δ c δi.e., the samples are illuminated only with collimated light. Note that in Fig. 6 (a), since rc is related to speed of light inside PDLC samples, this speed for translucent off and for transparenton states is almost the same, being higher for shorter wavelengths, corresponding to the visible range. The speed decreases for near infrared wavelength range, where rc increases. On the other hand, the extinction ε of light (by scattering or absorption) of Fig. 6 (b) is lower for transparent on state than for translucent off state for PDLC 25-A sample.
Unlike the independent behavior of rc with thickness and with applied voltage observed in Fig. 7 (left) and in contour plots of Fig. 8 (left) for both A and B PDLC samples, ε shows a dependent behavior of both thickness and applied voltage, showing a lower value for thinner devices at transparent on states. In principle, ε should show independency of thickness at translucent off states, since A and B PDLC samples were manufactured using the same material for the inner active layer. So, the discrepancies observed in Fig. 7 (right) for translucent off states should be related to the monolayer assumption−i.e., computations were carried out neglecting multilayer sandwich structure of PDLC samples, structure including thick glass substrate and transparent conductor thin film layers. Colorbar of contour plots of A and B PDLC samples at translucent off states in Fig. 8 (right) show closer values than at transparent on states. This indicates that the voltage level applied to PDLC samples of different thicknesses is related to the amount of light that is directly transmitted.
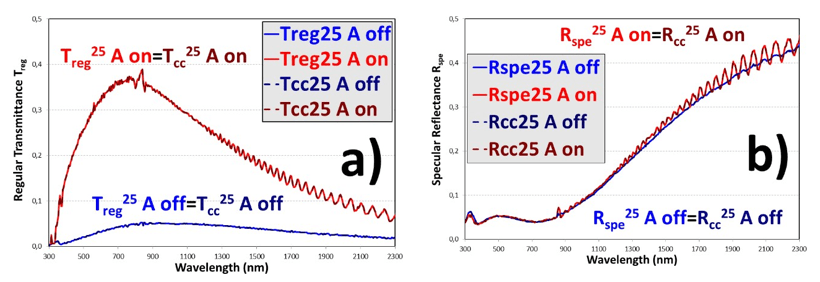
FIGURE 3
Regular transmittance Treg (a) and specular reflectance Rspe (b) of the PDLC 25-A sample, with fits to the collimated-collimated equations of the four-flux model (Tcc and Rcc)
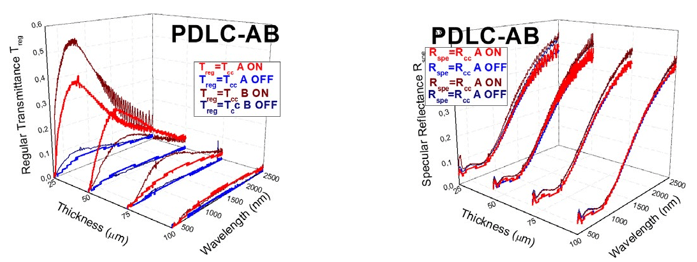
FIGURE 4
Regular transmittance Treg (left) and specular reflectance Rspe (right) for A and B PDLC samples, with fits to the collimated-collimated equations of the four-flux model Tcc and Rc
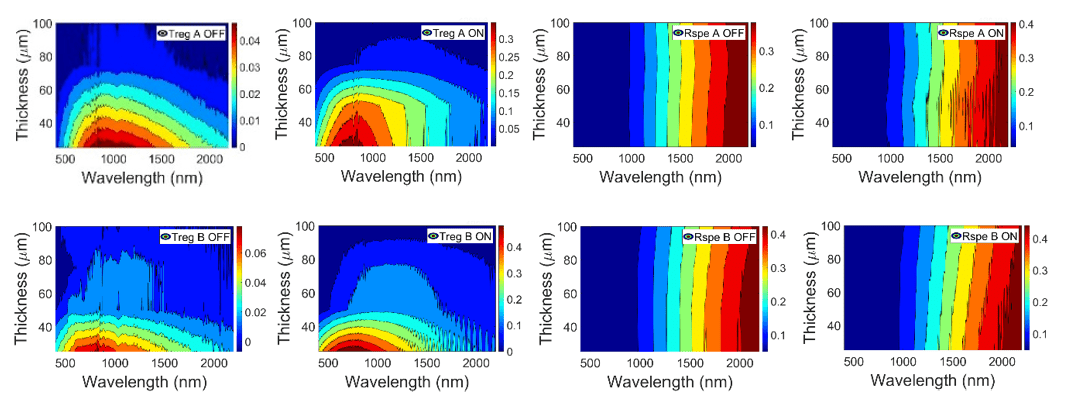
FIGURE 5
Regular transmittance Treg (left) and specular reflectance Rspe (right) contour plots for A (up) and B (down) PDLC samples.
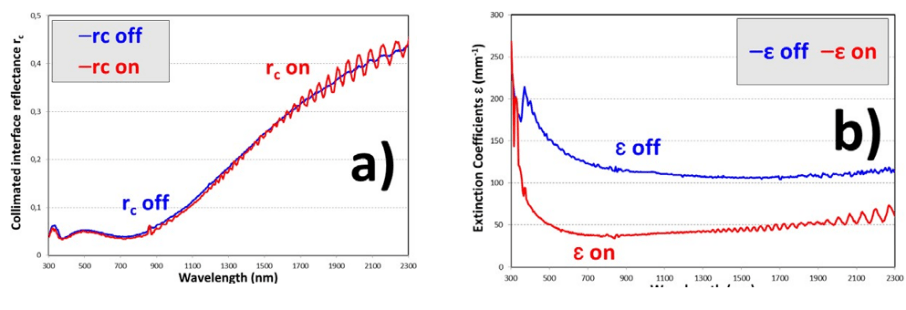
FIGURE 6
Collimated interface reflectance rc (a) and light extinction coefficients ε (b) of the PDLC 25-A sample
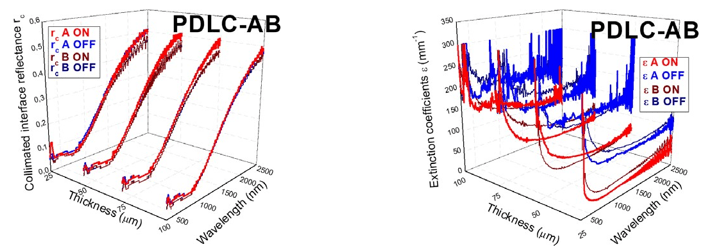
FIGURE 7
Collimated interface reflectance rc (left) and light extinction ε coefficients (right) for A and B PDLC samples
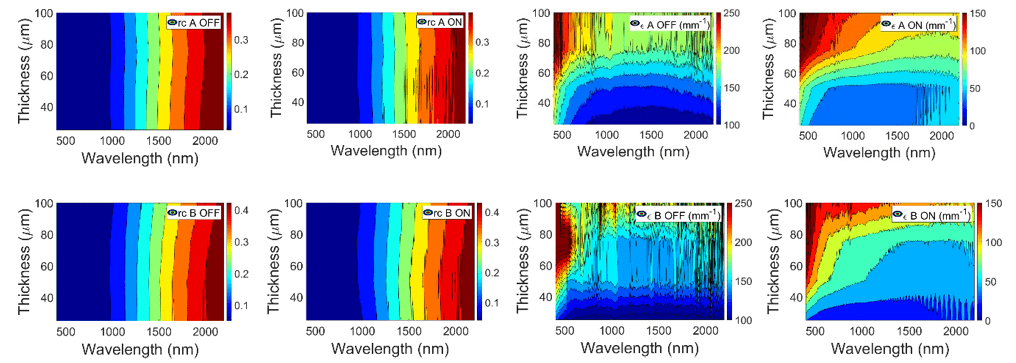
FIGURE 8
Collimated interface reflectance rc (left) and light extinction ε (right) contour plots for A (up) and B (down) PDLC samples
Extensive 2FM Scattering and Absorption Coefficients from Measurements of Total Transmittance and Reflectance
Extrinsic scattering and absorption coefficients (S and K, respectively) for the eight PDLC samples were determined by using hyperbolic equations of KM-2FM [7] together with Saunderson correction [8] in order to take the interfaces into account by fitting the calculated total transmittance and reflectance (Tt and Rt) to the measured total components of transmittance and reflectance (Ttot and Rtot). Total measurements and fittings of the PDLC 25-A sample, at translucent off and transparent on states, are detailed in Fig. 9. A perfect fitting is achieved for both optical appearances. As was the case with Treg and Rspe contrasts between translucent off and transparent on states in Fig. 3, the contrast between both optical states in Ttot is higher than in Rtot. However, Ttot contrast is lower than Treg contrast. This is because total transmitted light of Fig. 9 (a) includes diffuse transmitted light, and PDLC technology switches transmitted light from diffuse to direct with applied voltage. Oscillations due to interference effects [21] in total measurements are only observed for the transparent on state at the same infrared wavelength range as for collimated measurements.
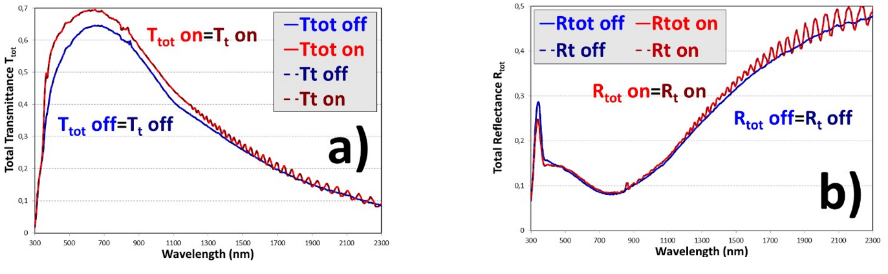
FIGURE 9
Total transmittance Ttot (a) and total reflectance Rtot (b) of the PDLC 25-A sample, with fits to the two- flux model with interface corrections Tt and Rt
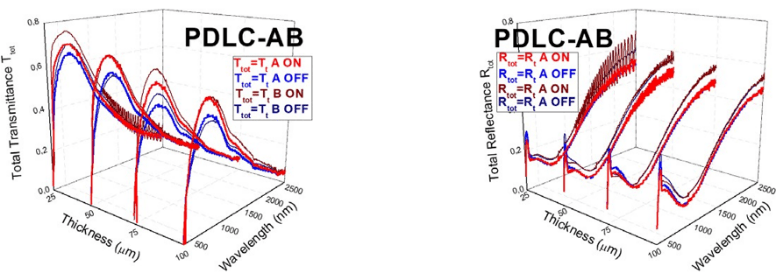
FIGURE 10
Total transmittance Ttot (left) and total reflectance Rtot (right) of A and B PDLC samples, with fits to the two-flux model with interface corrections Tt and Rt
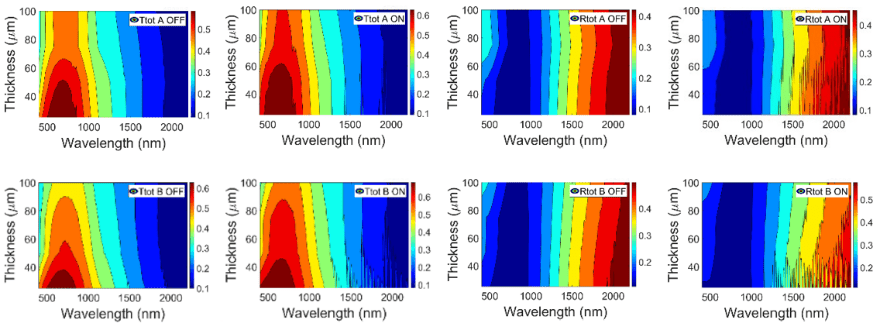
FIGURE 11
Total transmittance Ttot (left) and total reflectance Rtot (right) contour plots for A (up) and B (down) PDLC samples
Fig. 10 (left) shows a slight decrease of Ttot as the thickness increases, at both translucent off and transparent on states, for A and B PDLC devices. This behavior can be also observed with contour plots of Fig. 11 (left). As with Rspe in Fig. 4 (right), Rtot in Fig. 10 (right) is almost the same for the different thicknesses for both optical states. The thickness dependencies and independencies of Ttot and Rtot respectively of Fig. 10 and Fig. 11 can be compared with the thickness dependencies and independencies of Treg and Rspe respectively of Fig. 4 andFig. 5. Contrast between transparent on and translucent off states are lower for Ttot than for Treg due to the fact that PDLC samples transmit almost the same amount of total light, i.e., collimated and diffuse, at both optical states. At the transparent on states, Treg and transparency increase because Tdif and haze decrease.
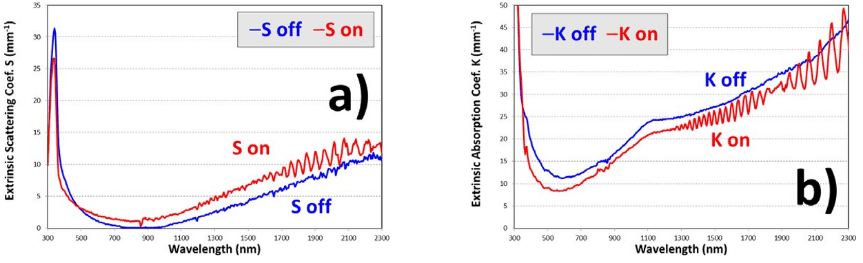
FIGURE 12
Extrinsic scattering S (a) and absorption K (b) coefficients of the PDLC 25-A sample derived from fits of the two-flux model with interface correction to experimental total components Ttot and Rtot
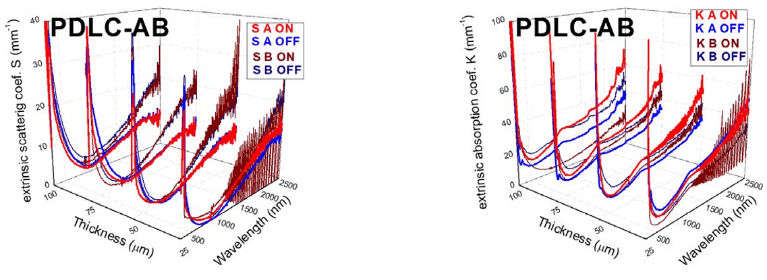
FIGURE 13
Extrinsic scattering S (left) and absorption K (right) coefficients obtained from fits of the two-flux model with interface correction to experimental total Ttot and Rtot components for A and B PDLC samples
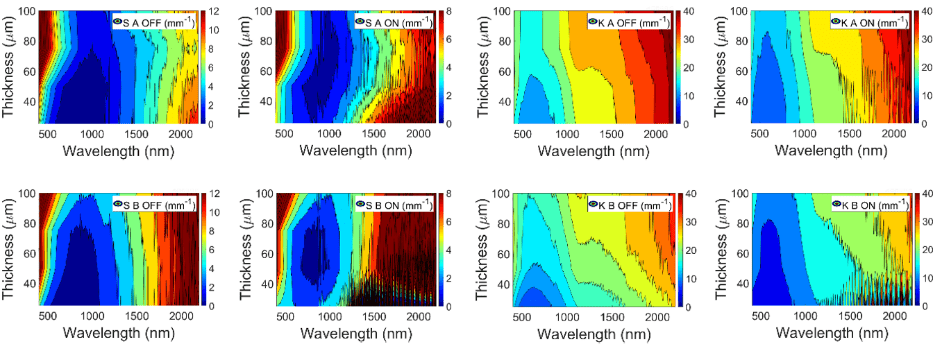
FIGURE 14
Extrinsic scattering S (left) and absorption K (right) coefficients contour plots for A (up) and B (down) PDLC samples
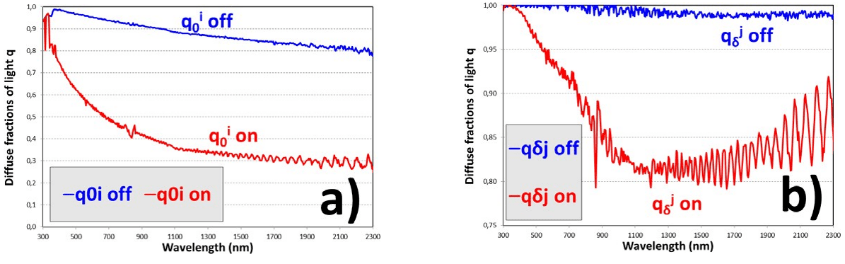
FIGURE 15
Diffuse fractions of light of the PDLC 25-A sample at front (δ) interface for forward (i) light beam q i0δ(a) and at back (0) interface for backward (j) light beam q j (b).
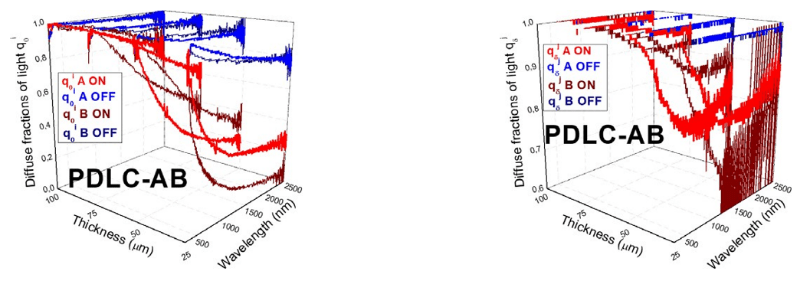
FIGURE 16
Diffuse fraction of light at front (δ) interface for forward (i) light beam q i (left) and diffuse fractionj 0of light at back (0) interface for backward (j) light beam qδ (right) for A and B PDLC samples
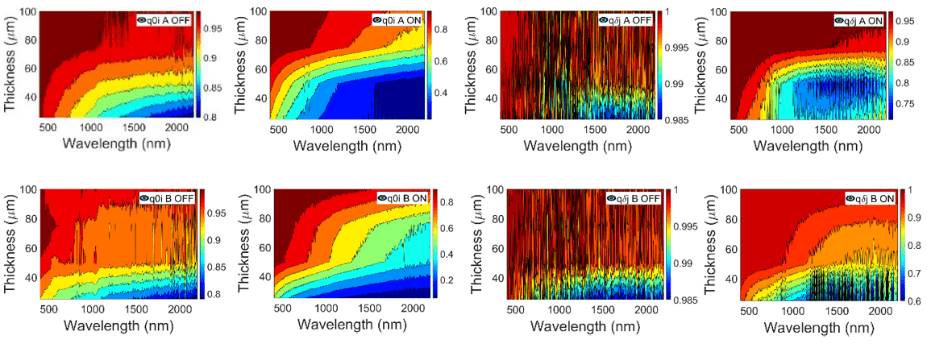
FIGURE 17
Diffuse fractions of light at back (0) interface for forward (i) light beam q i (left) and at front (δ)j 0interface for backward (j) light beam qδ (right) contour plots for A (up) and B (down) PDLC samples
Although Fig. 12 shows higher values for absorption K than for scattering S extrinsic coefficients for PDLC 25-A sample, and also a bit higher value of S for transparent on state than for translucent off state, this strange behavior could be due to the approximation suggested in [15] of using KM-2FM [7] with Saunderson correction [8] for samples showing not only diffuse but total T & R components, including collimated and diffuse instead of only diffuse. Higher values for K than for S are also observed in Fig. 13 and Fig. 14, showing a bit higher value of S for transparent on states and of K for translucent off states.
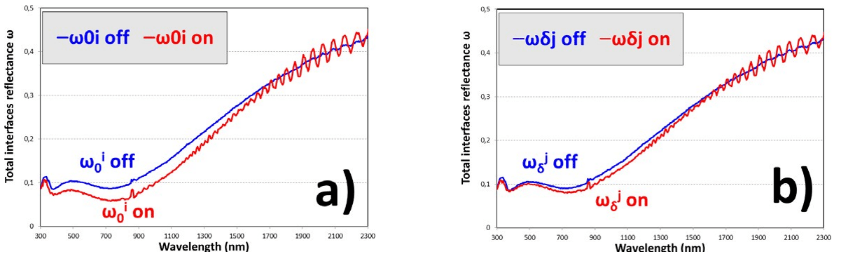
FIGURE 18
Total interface reflectance of the PDLC 25-A sample at front (δ) interface for forward (i) light beam ω i (a) and at back (0) interface for backward (j) light beam ω j (b)
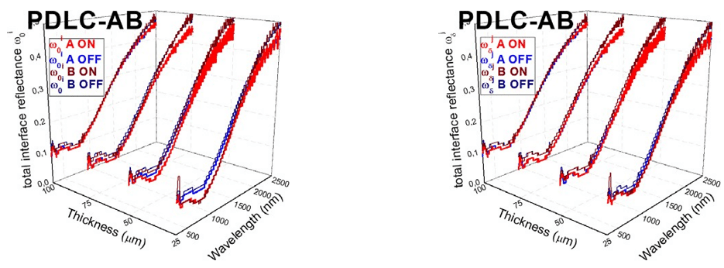
FIGURE 19
Total interface reflectance at front (δ) interface for forward (i) light beam ω i (left) and total interfacej 0reflectance at back (0) interface for backward (j) light beam ωδ (right)for A and B PDLC samples
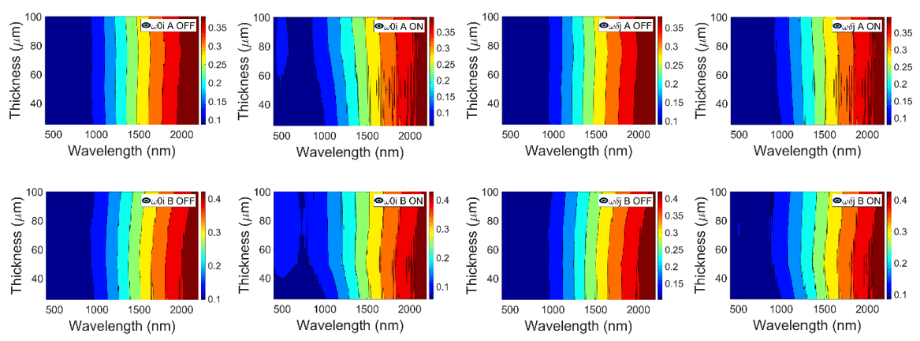
FIGURE 20
Total interface reflectance at back (0) interface for forward (i) light beam ω i (left) and at front (δ)j 0interface for backward (j) light beam ωδ (right) contour plots for A (up) and B (down) PDLC samples
Diffuse fractions of light q are defined as the ratio of diffuse/total intensities at the interfaces. Hence, q0i=i 0/(i 0+i 0) and q j=j δ/(j δ+j δ). Since the samples are only forwardilluminated through front interface, q j must always be higher than q i. As expected, bothδ 0q i and q j are also higher for translucent off states than for transparent on states. Values0 δfor PDLC 25-A are observed in Fig. 15. The values obtained for the different thicknesses inFig. 16 show higher oscillations of q j than of q i with the PDLC 25-B sample, due to theδ 0higher oscillations of Rtot than of Ttot in Fig. 10. As in previous contour plots, almost similar values for A and B PDLC samples are observed in Fig. 17.
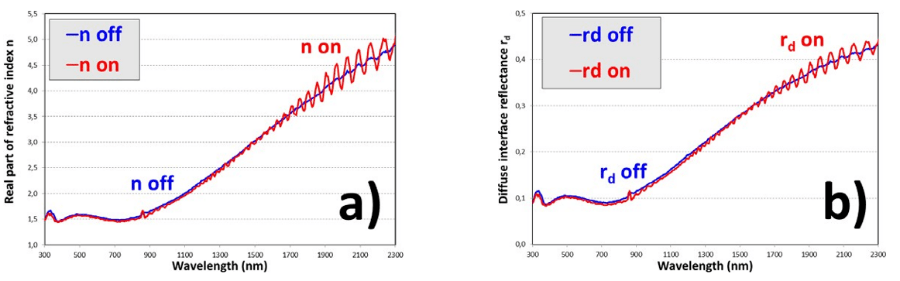
FIGURE 21
Real part of refractive index n (a) and diffuse interface reflectance rd (b) of the PDLC 25-A sample
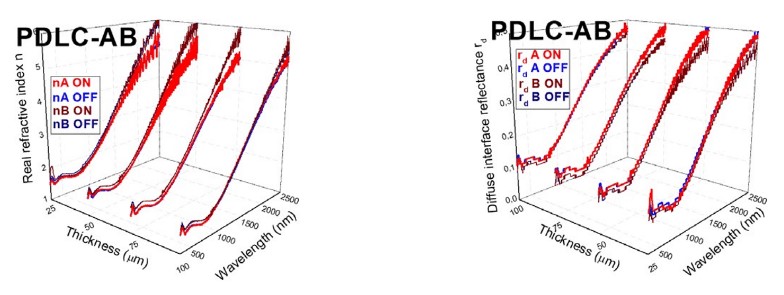
FIGURE 22
Real part of refractive index n (left) and diffuse interface reflectance rd (right) for A and B PDLC samples
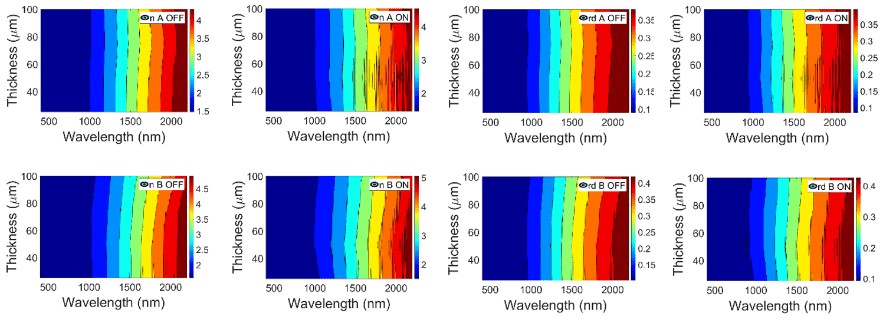
FIGURE 23
Real part of refractive index n (left) and diffuse interface reflectance rd (right) for A (up) and B (down) PDLC samples
Total inner interface reflectance at front and back interfaces for forward and backward light senses ω j and ω i show a similar behavior as r , i.e., total interface reflectance forδ 0 cδforward light sense at front interface, since q i=0. For PDLC 25-A, a bit higher differencebetween ω i and ω j is observed for transparent on state than for translucent off state0 δin Fig. 18. Fig. 19 and Fig. 20 show the independent behavior of ω i and ω j with thickness0 δ0δand also with optical states. In the same way as with rc, ω i and ω j, Fig. 21, Fig. 22, and Fig. 23show almost independent behavior of thickness and applied voltage for the real part of refractive index n and for diffuse interface reflectance rd.
Intrinsic 4FM Scattering and Absorption Coefficients from Measurements of Diffuse Transmittance and Reflectance
Intrinsic scattering and absorption coefficients (α and β, respectively) for the eight PDLC samples were determined by using the equations of MLG-4FM [6] by fitting the calculated collimated-diffuse transmittance and reflectance (Tcd and Rcd)−i.e., the diffuse component measured when illuminating with collimated light−to the measured diffuse components of transmittance and reflectance (Tdif and Rdif ).
Diffuse measurements and fittings of the PDLC 25-A sample, at translucent off and transparent on states, are detailed in Fig. 9. A perfect fitting is achieved for both optical appearances. As was the case with Treg and Rspe contrasts between translucent off and transparent on states in Fig. 3, the contrast between both optical states in Ttot is higher than in Rtot. However, Ttot contrast is lower than Treg contrast. This is because total transmitted light includes diffuse transmitted light and PDLC technology switch transmitted light from diffuse to direct with applied voltage. Interference effects are only observed for the transparent on state at the same infrared wavelength range as for collimated measurements.
Contrary to Treg in Fig. 3 (a), Tdif in Fig. 24 (a) shows higher values for translucent off states than for transparent on states for PDLC 25-A sample. This is in agreement with the closer values of Ttot in both optical states in Fig. 9 (a). On the other hand, Rdif shows the same independent behavior of Fig. 3(b) and Fig. 9 (b) with optical states as Rspe and Rtot in Fig. 24 (b). With higher thicknesses, Fig. 25 (left) shows how Tdif decreases for translucent off states and increases for transparent on states, due to the previous requirement of higher voltages applied to thicker PDLC samples, in order to increase transparency at the transparent on states. A slight increase of Rdif with thickness at both optical states is observed in Fig. 25 (right). Contrary to Treg contour plots of Fig. 5 (left), Tdif contour plots of Fig. 26 (left) show higher values when increasing thickness. Fig. 5 (right) and Fig. 26 (right) show the almost independent behavior with thickness and with optical state of Rspe and Rdif, respectively.
Intrinsic scattering α and absorption β coefficients for PDLC 25-A in Fig. 27 show the expected optical behavior not observed with extrinsic S and K coefficients, approximated as indicated in [15] using total instead of only diffuse T & R components. In this way, higher values for α than for β are observed for both optical states. The higher contrast between translucent off and transparent on states is observed for α, being smaller for β, in agreement with the closer values of Ttot at both optical states, i.e., rather than absorption, scattering is mainly modulated with applied voltage in PDLC samples. This is clearly observed for the different thicknesses for α in Fig. 28 (left) and for β in Fig. 28 (right). The higher variation with thickness occurs for α at transparent on states in Fig. 29.The procedure carried out for determining intrinsic coefficients, described in previous works [4,5], used the proposed Eq. (1) for the ACP parameter.
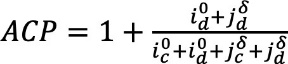
Eq. (1)
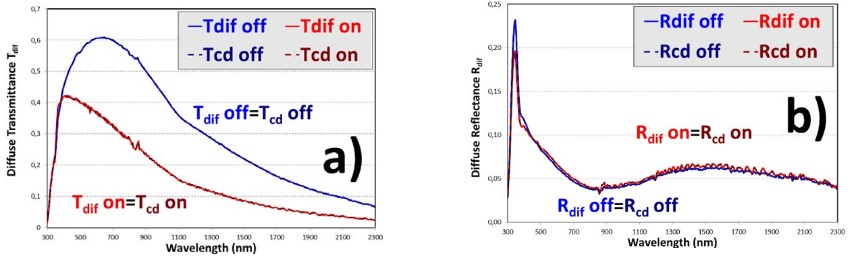
FIGURE 24
Diffuse transmittance Tdif (a) and reflectance Rdif (b) of the PDLC 25-A sample, with fits to the collimated-diffuse eq. of the four-flux model Tcd and Rcd
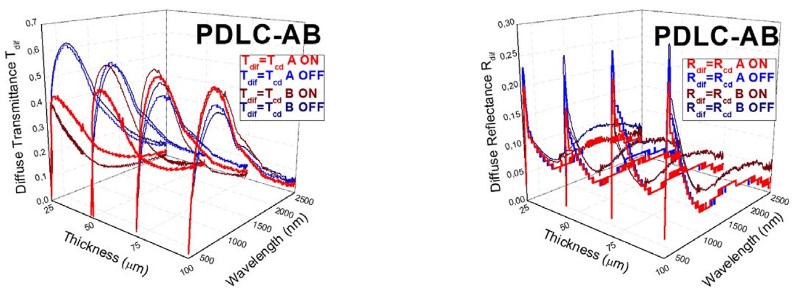
FIGURE 25
Diffuse transmittance Tdif (left) and diffuse reflectance Rdif (right) for A and B PDLC samples, with fits to the collimated-diffuse equations of the four-flux model Tcd and Rcd
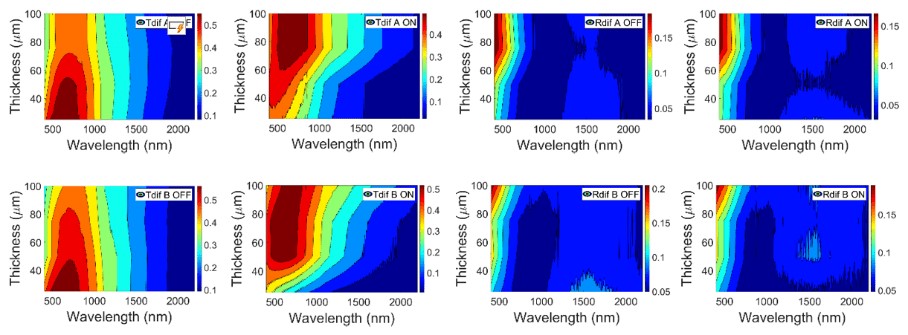
FIGURE 26
Diffuse transmittance Tdif (left) and diffuse reflectance Rdif (right) contour plots for A (up) and B (down) PDLC samples
The ACP parameter can vary from ACP=1, for only collimated light, to ACP=2, for only diffuse light. A value of ACP=30.5≈1.732 was used for the homogeneous clouds of Venus [22], being obtained as the main diagonal of a cube of normalized size, i.e., when light travels the same distance in the three cartesian axis, or (x2+y2+z2)0.5=30.5 if x=y=z=1. Feedback ACP parameter is obtained relating extrinsic K and intrinsic β absorption coefficients in Eq. (2) [16].
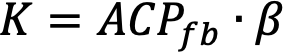
Eq. (2)
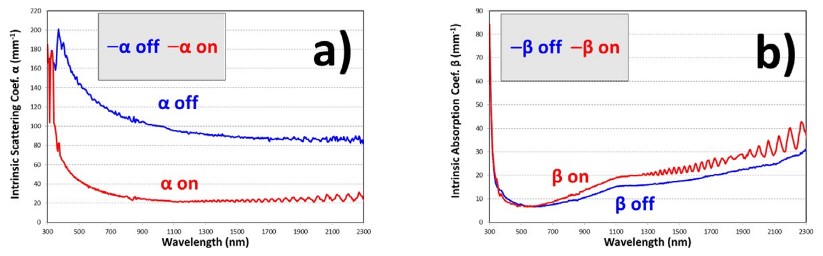
FIGURE 27
Intrinsic scattering (a) and absorption (b) coefficients of the PDLC 25-A sample obtained from fits of the four-flux model to experimental diffuse components Tdif and Rdif
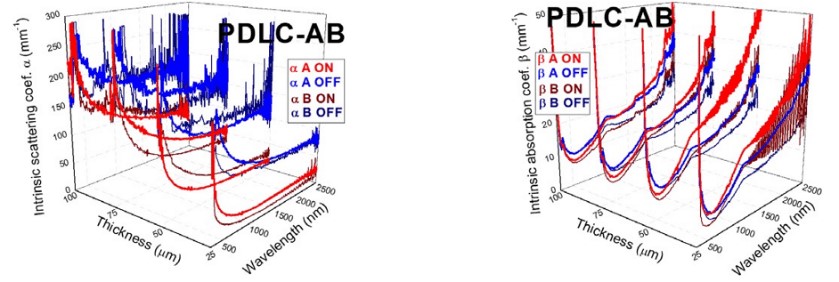
FIGURE 28
Intrinsic scattering α (left) and absorption β (right) coefficients obtained from fits of the collimated- diffuse equations of the four-flux model to experimental diffuse Tdif and Rdif components for A and B PDLC samples
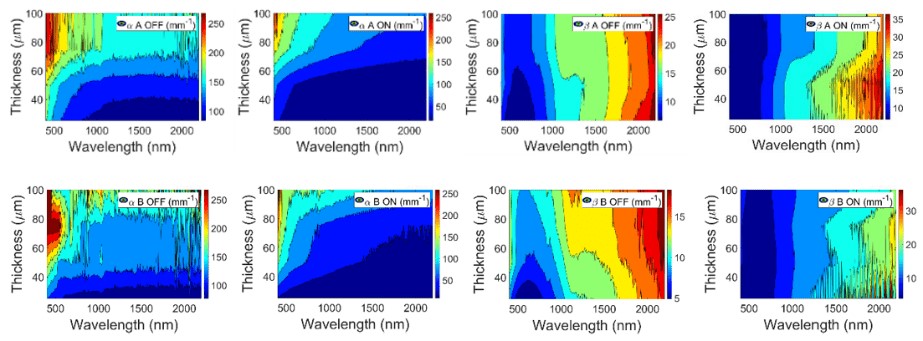
FIGURE 29
Intrinsic scattering α (left) and absorption β (right) coefficients contour plots for A (up) and B (down) PDLC samples
The lower value for ACP at transparent on state than at translucent off state for PDLC 25-A sample in Fig. 30 is related to the lower haze caused by the liquid crystals that get oriented inside the polymer when applying the AC voltage signal. Discrepancies between ACP and ACPfb seem to be smaller for the translucent off state, i.e., for higher values of haze. This is in agreement with the assumed errors when approximating KM- 2FM [7] with Saunderson correction [8] for samples showing partly collimated T & R components instead of only diffuse ones [15]. For thicker PDLC samples at translucent off states, the discrepancies between ACP and ACPfb are smaller than for thinner PDLC samples at transparent on states, as seen in Fig. 31 and Fig. 32.
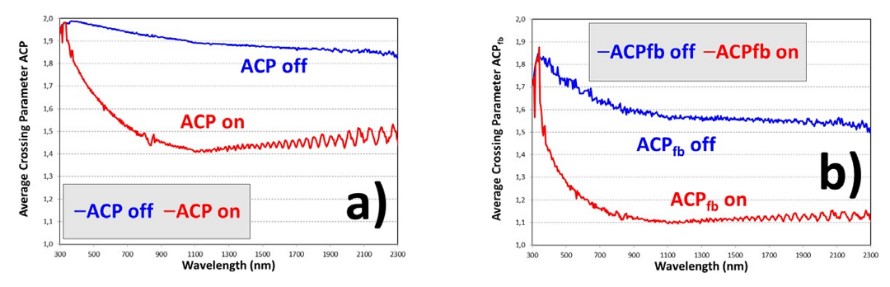
FIGURE 30
Average crossing parameter ACP (a) proposed in Eq. (1) and a comparison with ACPfb (b) computed inEq. (2), from a comparison of intrinsic β and extrinsic K absorption coefficients, of the PDLC 25-A sample
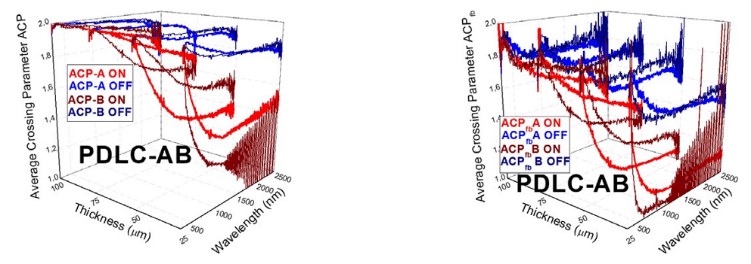
FIGURE 31
Average crossing parameter ACP (left) proposed in Eq. (1) and a comparison with ACPfb (right) computed in Eq. (2), from a comparison of intrinsic β and extrinsic K absorption coefficients, for A and B PDLC samples
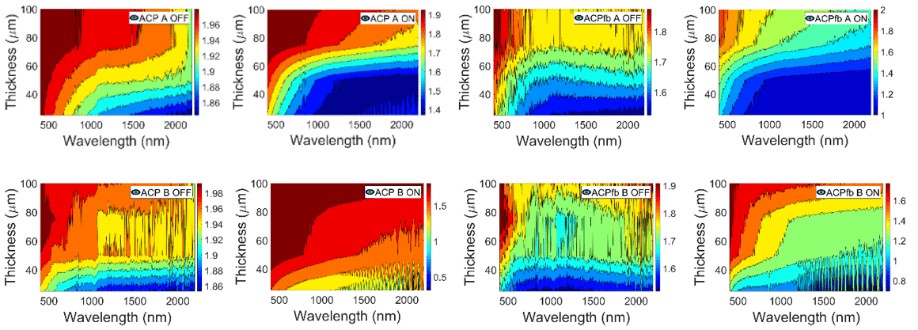
FIGURE 32
Average crossing parameter ACP (left) proposed in Eq. (1) and a comparison with ACPfb (right) computed inEq. (2), from a comparison of intrinsic β and extrinsic K absorption coefficients, for A (up) and B (down) PDLC samples.
In the same way as the other parameters−except ACP (whose values vary between 1 and 2), and extinction ε, intrinsic (α & β), and extrinsic (S & K) scattering and absorption coefficients−the value of the FSR parameter can vary between 0 and 1. FSR and α are obtained by fitting diffuse T & R measurements to MLG-4FM [6] cd equations, as was described in previous work procedures [4,5]. Feedback FSR parameter is obtained relating ACPfb, extrinsic S and intrinsic α scattering coefficients in Eq. (3) [16].
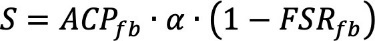
Eq. (3)
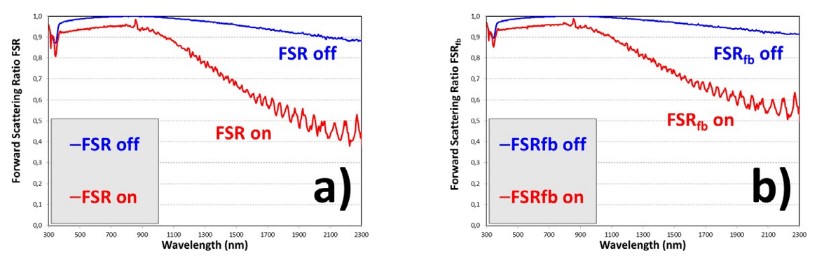
FIGURE 33
Forward-scattering ratio FSR (a) obtained from fits to the collimated-diffuse equations of the four-flux model, and a comparison with FSRfb (b) computed in Eq. (3) from a comparison of intrinsic (α and β) andextrinsic (S and K) scattering and absorption coefficients of the PDLC 25-A sample
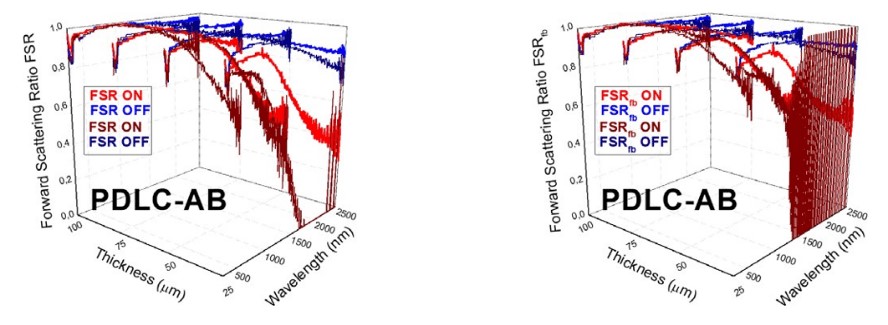
FIGURE 34
Forward-scattering ratio FSR (left) obtained from fits to the collimated-diffuse equations of the four- flux model and a comparison with FSRfb (right) computed in Eq. (3) from a comparison of intrinsic (α and β) and extrinsic (S and K) scattering and absorption coefficients for A and B PDLC samples
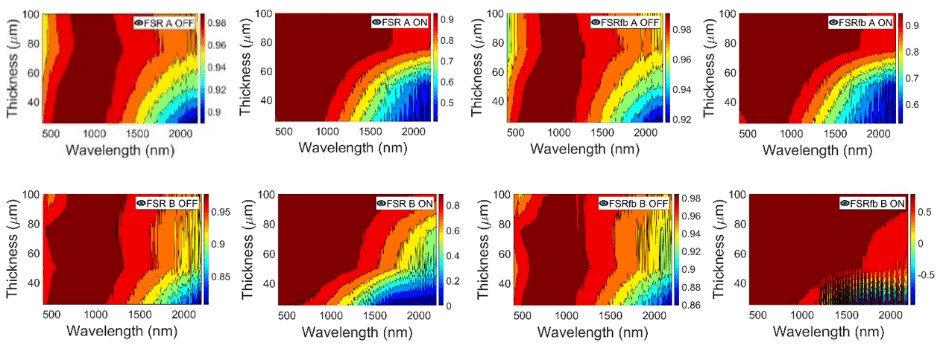
FIGURE 35
Forward-scattering ratio FSR (left) obtained from fits to the collimated-diffuse equations of the four- flux model and a comparison with FSRfb (right) computed in Eq. (3) from a comparison of intrinsic (α and β) and extrinsic (S and K) scattering and absorption coefficients for A (up) and B (down) PDLC samples
Compared with ACP and ACPfb parameters, FSR and FSRfb parameters show smaller discrepancies for the different thicknesses of PDLC samples, at both translucent off and transparent on states. From comparison of FSR and FSRfb for PDLC 25-A sample in Fig. 33, the higher haze of translucent off states seems to be the cause of the better approximated extrinsic coefficients using KM-2FM [7] with Saunderson correction [8]using the Levinson suggestion for samples showing total T & R components, instead of only diffuse ones [15]. Fig. 34 and Fig. 35 show a higher matching between FSR and FSRfb than that observed between ACP and ACPfb in Fig. 31 andFig. 32.
DISCUSSION
In this paper we have determined the scattering and absorption coefficients of eight polymer dispersed liquid crystal device samples of two different sizes of the active area and four different thicknesses of the inner active layer, at their translucent off and transparent on optical states, by using a procedure previously validated for a suspended particle device [4] and with a commercial polymer dispersed liquid crystal device [5] in a monolayer approximated method.
According to the definition of the inverse problem described in [23], four-flux [6,24,25] and two-flux [7,8] models can be used for determining scattering and absorption of light by small particles without any other information related to the samples characterized than the optical transmittance and reflectance measurements, i.e., “describing a dragon from its tracks” [23]. The inverse problem, considered the hard problem, differs from the direct problem, i.e., “describing the tracks of a given dragon” [23], which uses data such as size, shape, concentration of particles, and optical constants of the particles and of the host medium as input parameters for computing light intensities [26].
Other works [27,28,29,30,31] combine direct and inverse problems for this task. However, recent advances in the inverse problem with new equations determined for intrinsic and extrinsic coefficients were recently carried out [32,33,34,35,36] by differentiating two average crossing parameters (for forward and backward light senses) and four forward scattering ratios (for forward and backward light senses and for collimated and diffuse light beams). The new equations were determined when observing what was called the three-extinction matching requirement, obtained when the same extinction coefficients are computed in three different ways, i.e., from optical constants obtained with the procedure carried out using MLG-4FM [6] collimated-collimated equations for transmittance and reflectance and then from computed collimated light intensities substituted at the forward and backward collimated differential equations. The new equations were found for a sample consisting of three substrate layers [32], i.e., without thin film layers (layers with thickness lower than the wavelength of incident light beam). Multilayer matrixial methods [37,38] must be used with samples containing thin film layers (considered as special interfaces showing absorption of light). However, the three-extinction matching requirement is not observed when the sandwich structure of the characterized samples is approximated in a single layer method and a rule of three is applied to intrinsic and extrinsic coefficients [33,34,35]. Nevertheless, new optical constants of ITO thin film layer [36] recently obtained (that satisfied the three- extinction matching requirement) could be applied in previous works in multilayer method with the suspended particle device [39,40]. As future works, it would be of interest to apply this new procedure with polymer dispersed liquid crystals, with commercial [5] and with the eight samples characterized in the current work, in both single layer and multilayer methods.
REFERENCES
[1] Lampert, C.M. (1994). Glazing Materials for Solar and Architectural Applications. International Energy Agency. https://www.iea-shc.org/Data/Sites/1/publications/Task%2010-Glazing-Materials-for-Solar-and-Architectural-Applications-Sept1994.pdf
[2] Lampert, C.M. (1995). Chromogenic switchable glazing: Towards the development of the smart window. Window innovations conference. https://www.osti.gov/servlets/purl/207602
[3] Lampert, C.M. (1998). Smart switchable glazing for solar energy and daylight control. Sol. Energy Mater. Sol. Cells, 52(3-4), 207-221. doi: https://doi.org/10.1016/S0927-0248(97)00279-1
[4] Barrios, D., Álvarez, C., Miguitama, J., Gallego, D., & Niklasson, G.A. (2019). Inversion of two-flux and four-flux radiative transfer models for determining scattering and absorption coefficients for a suspended particle device. Appl.Opt., 58(31), 8871-8881. doi: https://doi.org/10.1364/AO.58.008871
[5] Barrios, D., Álvarez, C., Miguitama, J., Gallego, D., Wang, J., & Niklasson, G.A. (2022). Light scattering parameters of polymer dispersed liquid crystals obtained by inversion of experimental data. Proceedings of the Bremen Zoom Workshop on Light Scattering. https://scattport.org/index.php/conferences-menu/715-bremen-zoom-workshop-on-light-scattering-2022
[6] Maheu, B., Letoulouzan, J.N., & Gouesbet, G. (1984). Four-flux models to solve the scattering transfer equation in terms of Lorenz–Mie parameters. Appl. Opt., 23, 3353–3362. doi: https://doi.org/10.1364/AO.23.003353
[7] Kubelka, P. (1948). New contributions to the optics of intensely light-scattering materials: Part I. J. Opt. Soc. Am. 38, 448–457. doi: https://doi.org/10.1364/JOSA.38.000448
[8] Saunderson, J.L. (1942). Calculation of the color of pigmented plastics. J. Opt. Soc. Am., 32, 727–736. doi: https://doi. org/10.1364/JOSA.32.000727
[9] Kortüm, G. (1969). Reflectance Spectroscopy: Principles, Methods, Applications. Springer. doi: https://doi.org/10.1007/978-3-642-88071-1
[10] Kottler, F. (1960). Turbid Media with Plane-Parallel Surfaces. J. Opt. Soc. Am., 50(5), 483–490. doi: https://doi.org/10.1364/JOSA.50.000483
[11] Judd, D.B. (1942). Fresnel reflection of diffusely incident light. J. Research NBS, 29, 329-332. doi: https://doi.org/10.6028/jres.029.017
[12] Walsh, J.W.T. (1926). The reflection factor of a polished glass surface for diffused light. Department of Scientific and Industrial Research.
[13] Barrios, D., Vergaz, R., Sanchez-Pena, J.M., Granqvist, C.G., & Niklasson, G.A. (2013). Toward a quantitative model for suspended particle devices: optical scattering and absorption coefficients. Sol. Energy Mater. Sol. Cells, 111, 115–122. doi: https://doi.org/10.1016/j.solmat.2012.12.012
[14] Barrios, D., Vergaz, R., Sanchez-Pena, J.M., Granqvist, C.G., & Niklasson, G.A. (2015). Simulation of the thickness dependence of the optical properties of suspended particle devices. Sol. Energy Mater. Sol. Cells, 143, 613–622. doi: https://doi.org/10.1016/j.solmat.2015.05.044
[15] Levinson, R., Berdahl, P., & Akbari, H. (2005). Solar spectral optical properties of pigments– Part I: model for deriving scattering and absorption coefficients from transmittance and reflectance measurements. Sol. Energy Mater. Sol. Cells, 89, 319–349. doi: https://doi.org/10.1016/j.solmat.2004.11.012
[16] Vargas, W. E. (1999). Two-flux radiative transfer model under nonisotropic propagating diffuse radiation. Appl. Opt., 38, 1077-1085. doi: https://doi.org/10.1364/ao.38.001077
[17] Barrios, D., Torres, J.C., Marcos, C., Pinzón, P.J., Vergaz, R., Sánchez-Pena, J.M., & Viñuales, A. (2011). Dependence on the thickness and area of the parameters of equivalent electrical circuit model for devices in polymer dispersed liquid crystal on glass substrate. 74 Reunión Española de Optoelectrónica.
[18] Yang, D.-K., & Wu, S.-T. (2006). Fundamentals of Liquid Crystal Devices. John Wiley and Sons, Ltd. doi: https://doi.org/10.1002/9781118751992
[19] Ramsey, R. A., Sharma, S. C., Henry, R. M., & Atman, J. B. (2003). Electro-optical Properties and Interfacial Charges in Polymer-Dispersed Liquid Crystal Devices. Mat. Res. Soc. Symp. Proc., 771, 339-344. doi: https://doi.org/10.1557/PROC-771-L10.18
[20] Barrios, D., Álvarez, C., & Miguitama, J. (2019). Visual appearance simulation of polymer dispersed liquid crystal smart windows. V Congreso Internacional de Ciencia, Tecnología e Innovación para la Sociedad. Universidad Politécnica Salesiana. https://abyayala.org.ec/producto/5to-congreso-internacional-de-ciencia-tecnologia-e-innovacion-para- la-sociedad/
[21] Swanepoel, R. (1984). Determination of surface roughness and optical constants of inhomogeneous amorphous silicon films. J. Phys. E: Sci. Instrum., 17(10), 896-903. doi: https://doi.org/10.1088/0022-3735/16/12/023
[22] Sagan, C., & Pollack, J.B. (1967). Anisotropic nonconservative scatttering and the clouds of Venus. J. Geophys. Res., 72(2): 469-477. doi: https://doi.org/10.1029/JZ072i002p00469
[23] Bohren, C.F., & Huffman, D.R. (1983). Absorption and scattering of light by small particles. New York: Wiley. doi: https://doi.org/10.1002/9783527618156
[24] Beasley, K., Atkins, J.T., & Billmeyer Jr, F.W. (1967). Scattering and absorption of light in turbid media. Gordon & Breach Science Publishers.
[25] Maheu, B., & Gouesbet, G. (1986). Four-flux models to solve the scattering transfer equation: special cases. Appl. Opt., 25, 1122–1128. doi: https://doi.org/10.1364/ao.25.001122
[26] Mie, G. (1908). Contributions to the Optics of Turbid Media, Particularly of Colloidal Metal solutions. Annalen der Physik, 25, 377-445. doi: https://doi.org/10.1002/andp.19083300302
[27] Wang, J., Nilsson, A.M., Barrios, D., Vargas, W.E., Wäckelgård, E., & Niklasson, G.A. (2020). Light scattering materials for energy-related applications: Determination of absorption and scattering coefficients. Materials Today: Proceedings, 33, 2474-2480. doi: https://doi.org/10.1016/j.matpr.2020.01.339
[28] Vargas, W.E., Wang, J., & Niklasson, G.A. (2020). Scattering and absorption cross sections of light diffusing materials retrieved from reflectance and transmittance spectra of collimated radiation. Journal of Modern Optics, 67(11), 974- 991. doi: https://doi.org/10.1080/09500340.2020.1801872
[29] Vargas, W.E., Wang, J., & Niklasson, G.A. (2021). Effective backscattering and absorption coefficients of light diffusing materials retrieved from reflectance and transmittance spectra of diffuse radiation. Journal of Modern Optics, 68(12), 605-623. doi: https://doi.org/10.1080/09500340.2021.1936244
[30] Wang, J., & Niklasson, G.A. (2021). Extraction of light absorption and scattering coefficients of gold nanocomposites. Proceedings of the Bremen Zoom Workshop on Light Scattering. https://scattport.org/index.php/conferences-menu/689-bremen-zoom-workshop-on-light-scattering-2021
[31] Vargas, W.E., Wang, J., & Niklasson, G.A. (2022). Inversion of light scattering experiments by using the four-flux theory. Proceedings of the Bremen Zoom Workshop on Light Scattering. https://scattport.org/index.php/conferences-menu/715-bremen-zoom-workshop-on-light-scattering-2022
[32] Barrios, D. (2023). Forward scattering ratios, average crossing parameters and scattering and absorption coefficients new expressions using diffuse differential equations of four flux model. Proceedings of the Bremen Zoom Workshop on Light Scattering. https://scattport.org/index.php/programs-menu/multiple-particle-scattering-menu/739-scattering-workshop-2023
[33] Barrios, D. (2023). Parameters of differential equations in four-flux models approximated for multilayers samples showing scattering and absorption. XX ELS Electromagnetic and Light Scattering Conference.
[34] Barrios, D. (2023). Parameters of differential equations in two-flux models approximated for multilayers samples showing scattering and absorption. XX ELS Electromagnetic and Light Scattering Conference.
[35] Barrios, D. (2023). Parameters of differential equations in four-flux and two-flux models approximated for scattering and absorption results on solar thermal collector black paints. XVIII Encuentro de Física. Escuela Politécnica Nacional.
[36] Barrios, D. (2023). Optical constants and thickness gradients for light intensities in glass substrate layers and for complex electric fields in indium tin oxide (ITO) transparent conductor thin film layer, using Bode and Nyquist wavelength- dependent diagrams. XVIII Encuentro Internacional de Física. Escuela Politécnica Nacional.
[37] Pfrommer, P., Lomas, K.J., Seale, C., & Kupke, C. (1995). The radiation transfer through coated and tinted glazing. Solar Energy, 54, 287-299. doi: https://doi.org/10.1016/0038-092X(94)00132-W
[38] Harbecke, B. (1986). Coherent and incoherent reflection and transmission of multi-layer structures. Appl. Phys. B, 39, 165-170. doi: https://doi.org/10.1007/BF00697414
[39] Barrios, D., Vergaz, R., Sanchez-Pena, J.M., Mihelcic, M., & Orel, B. (2012). Decoupling scattering and absorption coefficients of internal color active layers of an inorganic WO3 and NiO based electrochromic device at bleached and colored states. IME’10: International Meeting on Electrochromism.
[40] Barrios, D., & Álvarez, C. (2023). Spectral voltage contour plots of optical constants and interface parameters of the active layer of a multilayer structure suspended particle device smart window from clear on to dark off states. Orbital: Electron. J. Chem., 15(1), 8-20. doi: https://doi.org/10.17807/orbital.v15i1.16470