

Sección A: Ciencias Exactas y Físicas
Processing of secondary radiation and cosmic ray data measured at flight altitudes with the pixel detector Timepix
ACI Avances en Ciencias e Ingenierías
Universidad San Francisco de Quito, Ecuador
ISSN: 1390-5384
ISSN-e: 2528-7788
Periodicity: Bianual
vol. 15, no. 2, 2023
Received: 19 October 2023
Accepted: 21 December 2023
Corresponding author: mariadelcarmensalazar1980@gmail.com

Abstract: Experimental data of the secondary radiation field and cosmic rays inside passenger aircraft in the atmosphere at airline altitudes (10-12 km) were processed. High- resolution data were measured by the semiconductor pixel detector Timepix operated in a miniaturized radiation camera MiniPIX-Timepix. The detector provides precise characterization with quantum sensitivity in terms of deposited energy and visualization of the charged particle radiation and X-ray field. The data were processed at the pre- processing and processing level with an integrated SW tool (Data Processing Engine- DPE). Results and physics data products consist of particle flux, dose rate, deposited energy, deposited dose, field composition into broad particle classes (protons, electrons, X rays), and detailed visualization of the radiation field with quantum imagingregistration of single particle tracks. In this work, the detailed analysis of two measurements, as well as comparative graphs of selected results between ten flights, is presented. Results of total absorbed dose are compared with values measured also by Timepix detectors on ground and in LEO orbit onboard a satellite.
Keywords: radiation detection, radiation in the atmosphere, particle tracking, radiation imaging, pixeldetectors, nuclear physics, cosmic rays.
Resumen: En este trabajo se procesaron datos experimentales del campo de radiacio´n mixta medidos en el interior de aviones de pasajeros en la atmo´sfera a altitudes ae´reas (10- 12 km). Los datos detallados fueron medidos por el detector de p´ıxeles semiconductor Timepix operado en una ca´mara de radiacio´n miniaturizada MiniPIX-Timepix, el cual proporciona caracterizacio´n precisa, sensibilidad cua´ntica en te´rminos de energ´ıa depositada y la visualizacio´n de radiacio´n de part´ıculas cargadas. Los datos se procesaron con una herramienta SW integrada (Data Processing Engine-DPE). Los resultados y productos de para´metros f´ısicos consisten en flujo de part´ıculas, tasa de dosis, energía depositada, dosis depositada, composicio´n del campo en amplias clases de part´ıculas (protones, electrones, rayos X), as´ı como la visualizacio´n detallada del campo de radiacio´n y registro de ima´genes cua´nticas de huellas de part´ıculas individuales. En la parte principal de este trabajo se presenta el ana´lisis detallado de dos mediciones, as´ı como gra´ficos comparativos de resultados seleccionados entre todos los vuelos. Los resultados de la dosis total absorbida se comparan con los valores medidos en tierra y en o´rbita LEO a bordo de un sate´lite.
Palabras clave: detección de radiación, radiación en la atmósfera, detectores de pixeles, física nuclear, física de partículas, rastreo de partículas, rayos cósmicos.
INTRODUCTION
There are several reasons to study and measure the radiation field in aircraft at flight altitudes [1]. Although we are all exposed to a certain dose of radiation in our daily lives, aircrew members and passengers are subjected to a higher radiation exposure rate than people on the ground under natural conditions [2]. The increase in ionizing radiation with increasing altitude is due to the interaction of galactic cosmic radiation (GCR) with the atmosphere. The composition, intensity, and energy spectra of primary particles are modified by energy loss, nuclear interactions, and secondary particles created [2].
According to the ICRP (International Commission on Radiological Protection) recommendations [3], the exposure of aircrew members to cosmic radiation in jet aircraft may be regarded as occupational exposure, so monitoring the radiation exposure of crew and passengers is not just important, but necessary. It also serves to study the effects of radiation on electronic and avionics components [4], as well as space weather physics in the atmosphere at airline altitudes. These measurements can also play a role in detecting and studying energetic and highly variable solar particle events (SPE) and coronal mass ejections [5].
Semiconductor pixel detector Timepix
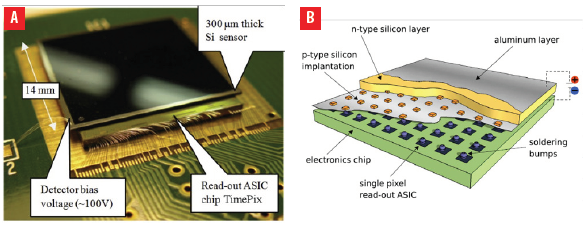
The hybrid semiconductor pixel detector Timepix, developed by CERN Medipix Collaboration [6], is asuitable device for accurate in-flight radiation dosimetry [5]. Timepix provides single-quantum sensitivity (photon counting), per-pixel spectrometry, high granularity, noiseless (dark-current free) detection, and particle tracking capability [7]. The detector consists of a radiation-sensitive semiconductor sensor, which is bump- bonded to the pixelated readout ASIC Timepix chip as can be seen in Figure 1. It is equipped with highly integrated signal per-pixel (px) electronics (amplifier, amplitude discriminators, digital counter) [6].
These detectors can use sensors made of different materials (Si, CdTe, GaAs) and thicknesses (100 µm, 300 µm, 500 µm, and 1000 µm for Si). Timepix provides a high-density matrix of 256 × 256 energy- sensitive pixels (total of 65.536 essentially independent pixels) with a pixel pitch of 55 µm and a full sensitive area of 14 mm × 14 mm = 1.98 cm2 [6].
Radiation Camera MiniPIX-Timepix
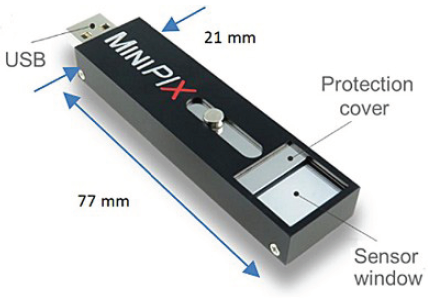
The pixel detector was operated as a compact radiation camera MiniPIX-Timepix which is developed and supplied by Advacam [8]. The MiniPIX is a miniaturized, low-power consumption, single particle counting (or particle tracking) radiation camera (shown in Figure 2) equipped with the semiconductor pixel detector Timepix. The standard MiniPIX system incorporates a single Timepix detector (256 x 256pixels with a pitch of 55
µm) with sensor according to customer preference and standard 300 µm thick silicon as used for this project. The chip-sensor array provides quantum imaging sensitivity for high-resolution spectral tracking of single particles in mixed radiation fields [9]. MiniPIX connects by a single USB 2.0 connector capable of reading up to 45 frames per second (with an exposure time of 1 ms), weighs 25 g, has a power of consumption of 1W, and can be operated at room temperature withoutthe need for active cooling [8]. It is compatible with all major operating systems (MS Windows, Mac OS, and LINUX). The software used to operate the detector, including online response, data readout, andpre-processing, is the PIXET software, also built by Advacam, and can be run on a standard PC.
METHODOLOGY
The work presented is based on the high-sensitivity detection and precise measurement of radiation in fields such as radiation in the atmosphere, space weather, and cosmic rays. The measurements were performed with the radiation camera MiniPIX-Timepix, in the passenger area of commercial aircrafts at several routes. The Timepix detector was configured to run in energy (TOT) mode, which means the deposited energy per pixel is registered.
Quantum-imaging detection of radiation
The hybrid architecture of the Timepix detector provides fast and noiseless (dark-current free) detectionof single quanta [6]. It is energy sensitive in terms of deposited energy of low energy charged particlesand X-rays. The range of energies that it can detect goes from a few keV (X-rays), tens of keV(electrons), hundreds of keV (protons), and few MeV (ions) [9]. For Silicon sensors, a few tens of keV is the upperrange for X-rays and gamma rays, which are detected with limited detection efficiency [9]. For charged particles, Timepix detects all particles, including minimum-ionizing particles such secondary cosmic ray muons and relativistic electrons.
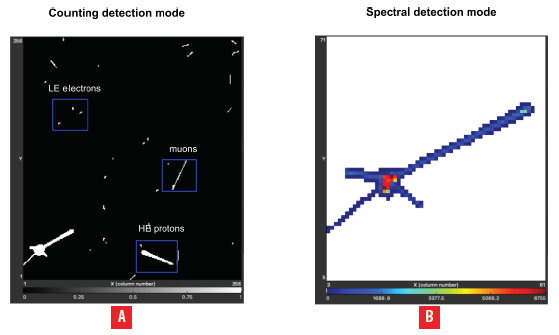
An example of measured data is given in Figure 3, showing the detection and visualization of the radiation field in flight. The single particle tracks are displayed in quantum-imaging in either (a) counting mode or in (b) energy mode at the pixel (px) level (black=zero radiation detected, white=radiation detected). The color bar serves as an indicator of deposited energy. All events are registered and processed. Low-energy transfer particles or LCPs such as X-rays and electrons produce small and narrow tracks [5]. High-energy transfer particles or HCPs produce large and broad tracks [9].
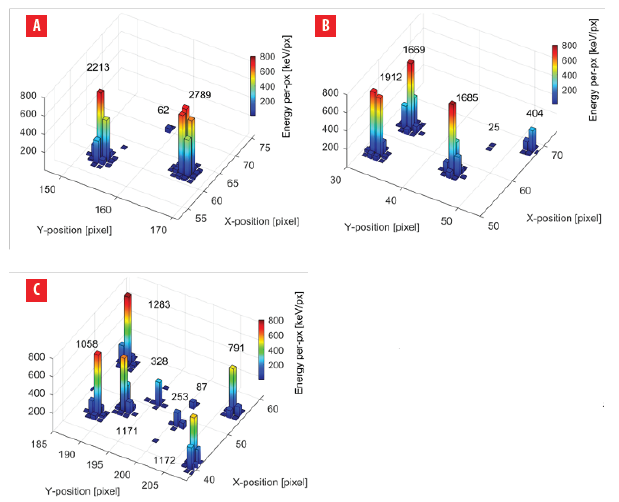
A more detailed example of quantum imaging detection and per-pixel scale spectrometry of single particles is shown in Figure 4. Just a small region of the detector matrix is shown for detail and clarity. The data was measured from an 241Am radionuclide source of low-energy gamma rays (which are registered as small tracks of few pixels), X-rays (registered as small tracks of 1 or 2 pixels) and alpha particles (produce large tracks of many pixels) [9].
Measurements
A total of 10 measurements at operational flight altitudes with different routes, dates, and duration wereprocessed. The flights with a duration≤ 2 hrs were referred to as “short flights,” and the other five flights with a duration ≥ 7 hrs were referred to as “long flights,” For these measurements, the semiconductor pixel detector Timepix (tpx) and the radiation camera MiniPIX (mpx) were operated in frame mode withan acquisition time of 10 s. The detector was pre-calibrated for per-pixel energy.
The total elapsed time from the start of the measurements until the detector is turned off is the sum of the detector live time + detector dead time (approx 30 ms). The detector’s live time is the time intervalin which the data is measured and transferred to the computer system in the dead time. Table 1 shows the measurement results and how the flights were organized.
| Label | Date | Route | Route type | Live time [min] | Radiation camera/chip/ SN |
| A | 2022/09/04 | PRG-BRUSS | SF | 39 | mpx/tpx/I10 |
| B | 2021/11/10 | PRG-MOSCOW | SF | 120 | mpx/tpx/H09 |
| C | 2019/06/30 | TOK-WARSAW | LF | 401 | mpx/tpx/I10 |
| D | 2019/06/16 | WAR-TOK | SF | 75 | mpx/tpx/I10 |
| E | 2019/06/16 | WAR-TOK-NP | LF | 620 | mpx/tpx/I10 |
| F | 2018/12/31 | PARIS-TOK | LF | 685 | mpx/tpx/I10 |
| G | 2018/11/10 | PRG-DUB.2 | LF | 815 | mpx/tpx/I10 |
| H | 2018/11/10 | PRG-DUB.3.1 | SF | 80 | mpx/tpx/I10 |
| I | 2018/11/10 | PRG-DUB.3.2 | SF | 115 | mpx/tpx/I10 |
| J | 2018/11/10 | PRG-DUB.3.3 | LF | 653 | mpx/tpx/I10 |
Data Processing
Data processing was performed using the software tool DPE (Data Processing Engine) developed and provided by Advacam. The DPE tool serves for processing of data acquired with the Timepix detectors (tpx, tpx2, tpx3) [11]. The main processing parts of the DPE are:
• Pre-processing: Stage for single track clustering, per-px energy calibration is made with detailed event-by-event pattern recognition, and calculation of cluster variables/parameters.
• Processing: Production of histograms, particle and radiation field recognition, classification of particle type events.
• Post-processing: Directional analysis, coincidence analysis, Compton camera, physics product production (particle fluxes, dose rates, deposited energy, LET spectra) and time evolution in relation to radiation field classification.
RESULTS
Detailed results are presented for measurements . and . described in Table 1.
Detection and visualization of radiation field
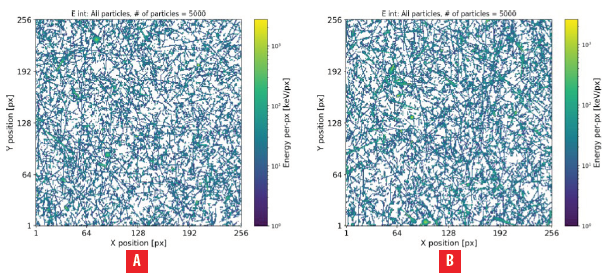
Single particles are detected as energy-sensitive tracks called clusters. The per-pixel deposited energy is shown in Figures 5 and 6 in the color scale (in keV/px, log scale). The entire detector pixel matrix is displayed, that is, 256 x 256 pixels = 1.98 cm2 = 65536 pixels.
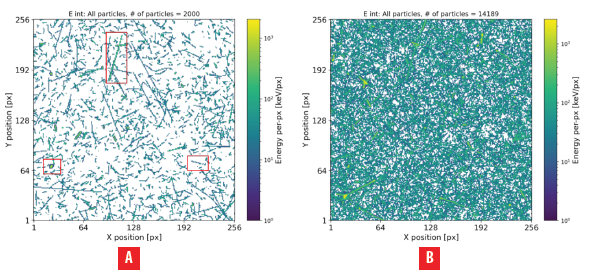
Composition characterization
There is information contained in the morphology and per-pixel spectrometry depending on the particle type, spectra response (energy loss), and direction of incidence to the detector sensor plane [5]. Single particles generate signals in the pixelated semiconductor sensor that involve many pixels forming a cluster of pixels. The charge-sharing effect and the convolution of the deposited charge along its course produce the pattern and morphology of the pixel clusters. High-resolution micro-scale pattern recognition algorithms examine the individual particle tracks with the aim of identifying particle types. [9].
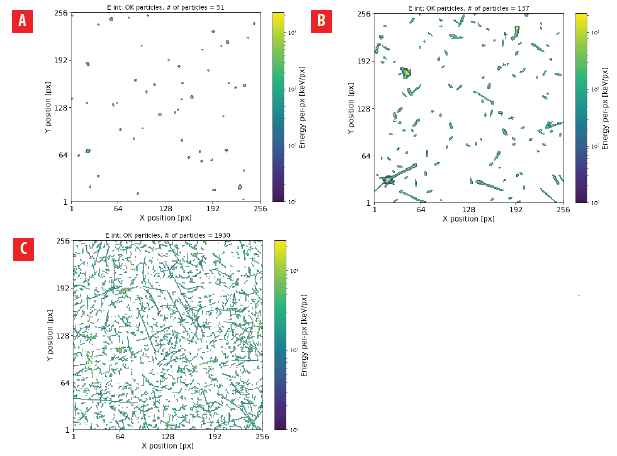
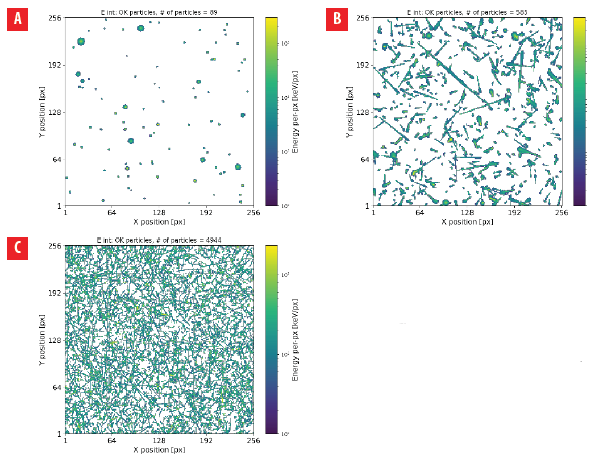
High-energy charged particles traveling in non-perpendicular directions create large tracks with intense energy per pixel. Low-energy charged particles moving perpendicularly to the detector or high-energy particles at perpendicular angles form smaller tracks with minimal per-pixel energy. X-rays generate tiny tracks with few pixels and low energy per pixel. Additionally, interactions involving electrons and gamma rays result in thin, intricate tracks of diverse sizes and shapes, accompanied by low per-pixel energy [5]. Taking this into account, the tracks were filtered into 3 different classes as shown in Table 2.
| Class | Selected Particles Description |
| a | Low-energy and/or perpendicular high-let HCPs, namely protons. |
| b | High-energy and/or non-perpendicular high-let HCPs, namely protons. |
| c | Low-let LCPs, namely electrons, X rays, gamma rays, muons. |
Event count rates
According to particle class, photons and electrons were the particles detected with highest intensity; heavy charged particles such as protons were detected with lower intensity. Table 3 shows the number of protons, photons, electrons, and light ions (low- energy protons) detected during the sampling time of flights . and . described in Table 1.
| Label | Protons | Photons and Electrons | Ions | Total particles | ||||
| (#) | (%) | (#) | (%) | (#) | (%) | (#) | (%) | |
| B | 1112 | 7.8 | 13068 | 92.1 | 9 | 0.1 | 14189 | 100 |
| G | 1917 | 3.7 | 50488 | 96.3 | 36 | 0.1 | 52441 | 100 |
Particle fluxes
The radiation field can be evaluated in terms of particle flux with particle-type composition sensitivity [5]. The flux of a quantity is defined as the rate at which this quantity passes through a fixed boundary per unit of time. In this case, we are interested in knowing the flux of the different types of particles that have been detected during the flight. The approximate flux can be obtained by normalizing the event count rate to the sensor area (1.98 cm2) per unit time. Detector efficiencies still need to be taken into account for obtaining real particle flux measurements. Table 4 shows the total particle count, measuredlive time displayed in minutes, and the total flux for each measurement described in Table 1.
| Label | Particles count (#) | Measured live time (min) | Flux (#/min/cm2) |
| A | 3616 | 38.94 | 46.9 |
| B | 14189 | 119.82 | 59.8 |
| C | 47421 | 400.2 | 59.7 |
| D | 3974 | 76.09 | 25.4 |
| E | 83752 | 620.07 | 68.2 |
| F | 86577 | 685.97 | 63.7 |
| G | 52441 | 814.78 | 32.5 |
| H | 4728 | 80.88 | 29.5 |
| I | 9350 | 113.83 | 41.5 |
| J | 44906 | 651.82 | 34.8 |
Selected flights
Figures 9a and 10a present the particle flux of all types of particles for the two flights previously describeda, nd Figures 9b and 10b show the flux by particle class.
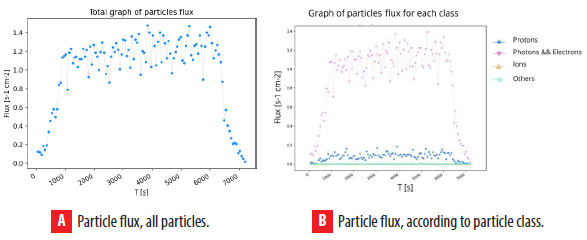
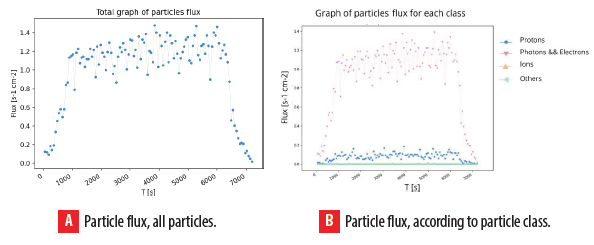
It can be seen that the particle flux increases after the first few minutes of flight.This corresponds to the airplane taking off and gaining altitude, as there are more particles observed than on the ground. The same can be said for the last minutes of the flights; when descending to the ground, the ionizing radiation also decreases. Figure 10b shows an increment in charge particles detected in the last period of the flight. These variations correspond to an increase in flight altitude or changes in the cosmic ray flux over long distances.
| Label | Protons flux (#/min/cm2) | Photons and Electrons flux (#/min/cm2) | Ions flux (#/ min/cm2) | Total particles flux (#/min/cm2) |
| B | 4.68 | 55 | 0.04 | 59.72 |
| G | 1.19 | 31.25 | 0.02 | 32.46 |
For obtaining the particle fluxes shown in Table 5, the total number of particles detected (by class) isdivided by the sampling time in minutes of each flight and for the sensor area.
All flights
The particle fluxes of all flights in Table 1 were compared. Plots of the flux of all particles detected and selected particles in short and long flights are presented in Figures 11 and 12.
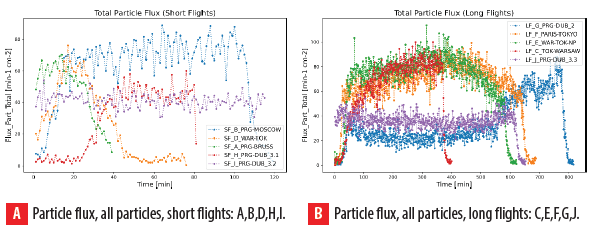
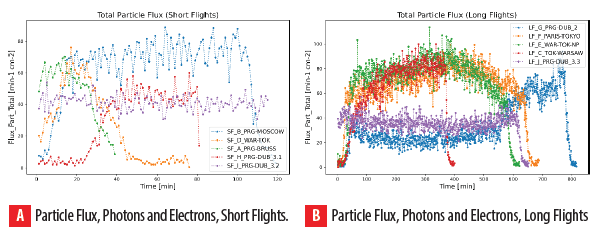
From Figures 11a and 12a, it can be concluded that the short flight with the highest particle flux and, therefore, the highest radiation was flight .; from Figures 11b and 12b, it can be said that the longflights with the highest radiation were flights . and ., which makes sense since both flights had the samedestination (see Table 1).
Deposited Energy
The deposited energy (DE) is described as the amount of energy deposited by ionizing radiation in a material per unit mass of the material [12].
Time distribution
Figures 13 and 14 show the deposited energy (measured in keV per time) of the selected flights . and . described in Table 1. The DE of all particles detected and then separated by particle class is shown. Figures 15, 16, and 17 show the deposited energy of all particles, protons, and photons, respectively, of all short and long flights described in Table 1.
Selected Flights
In Figures 13 and 14, the x-axis, which corresponds to the time in seconds, only takes into account the live time of the detector; it does not include the detector readout dead-time, which is negligible anyway (30 ms in comparison to 10 s, which is the frame acquisition time).
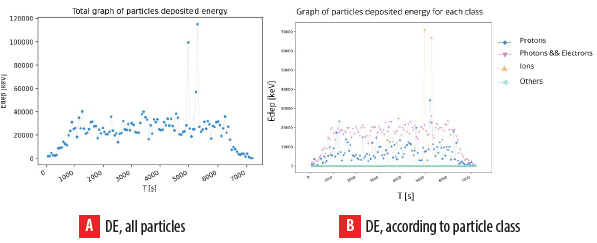
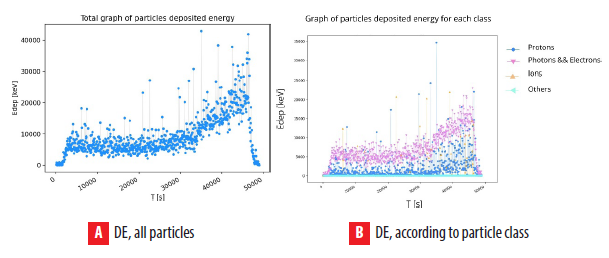
As seen in the previous sections, photons and electrons contribute the highest particle count. However, the presence of protons and ions (HCPs) is notably limited. In Figure 13b and 14b, we can see the distribution of deposited energy depending on the particle type. Despite the relatively low abundance of protons and ions, their cumulative deposited energy constitutes a substantial component of the overall deposited energy (DE). Table 6 shows the average of deposited energy by particle class (protons, photons/ electrons, and ions).
| Label | DE by protons (keV) | DE by photons and electrons (keV) | DE by ions (keV) | Average DE (keV) |
| B | 6935.5 | 15322.2 | 1539.8 | 23797.5 |
| G | 2025.6 | 7069.3 | 310.56 | 9405.5 |
All Flights
Deposited energy plots were generated for all particles and the different particle types, as can be seen in Figures 15, 16 and 17. The measurements were categorized into short flights (SF) and long flights (LF), as detailed in Table 1 for an easier comparison.
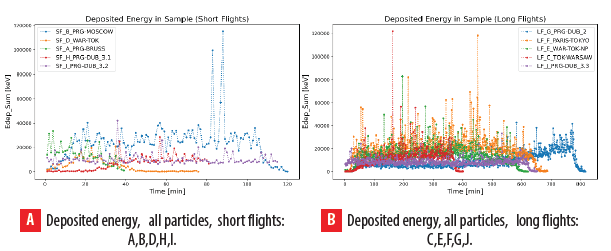
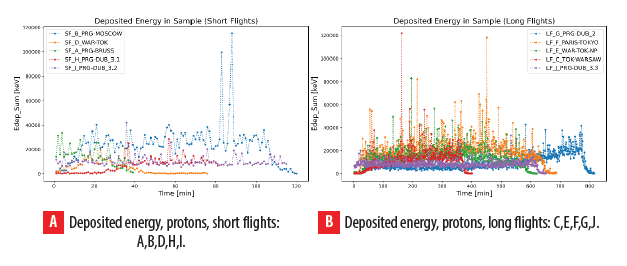
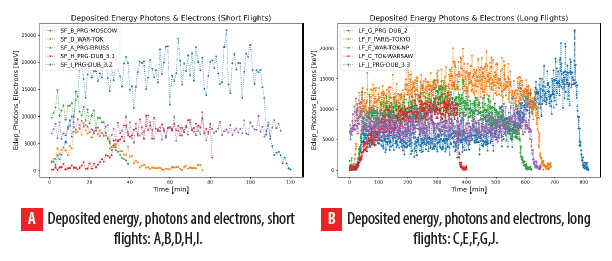
It can be observed from Figure 16a and 16b that, although the deposited energy by protons has certainenergy peaks, on average, photons and electrons are the particles that deposit the most energy during theflight (See also Figure 17a and 17b). Likewise, according to Figure 15, the short flight with the highest deposited energy was flight ., and the long flights with the highest DE were flights . and ..
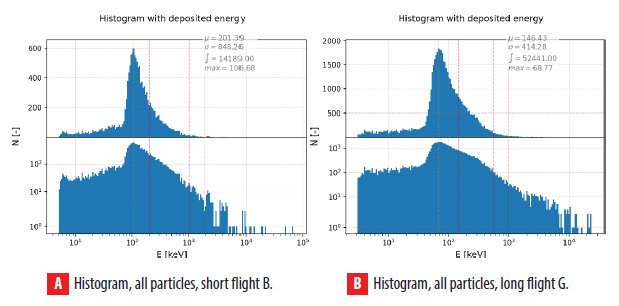
Deposited Energy Spectra
The Timepix detector can measure the deposited energy by any particle. In Figure 18 the deposited energy spectra with all particles displayed can be seen. At the top of the following images, a lineal axis is used while a logarithmic axis is used at the bottom.

As can be seen, the deposited energy spectrum is wide, covering ranges from a few keV up to MeV level. The vertical lines shown in Figure 18 will be explained successively from left to right. The yellowvertical line indicates the position of the maximum value. The first red line shows the position of the mean value (µ); the second shows the mean value + standard deviation (µ+σ ); and the third indicates the mean value + 2 times the standard deviation (µ+2σ). The hard part of the spectrum is slightly above 100 keV, which is deposited mostly by protons and HCPs. The soft part of the spectrum, on the other hand, is below 100 keV; this part is produced by LCPs, electrons, X rays, and gamma rays. The energy distribution is quite similar between the two figures, the difference being that less particles were detected in the short flight . than in the long one ..
Dose rates
The absorbed dose is obtained as the ratio .ε/dm, where dε is the average energy deposited by radiation to a material of mass dm:
 (1)
(1)The absorbed dose rate (DR) is defined as the rate dD/dt where dD is the inv crease in absorbed doseduring the time interval dt:
 (2)
(2)Dose rate is often indicated in micro grays per hour [µGy/h].
Selected flights
Figures 19 and 20 show the resultant dose rate (µG/h) throughout flights . and ., described in Table1. The dose rate obtained from all particles is shown in Figures 19a and 20a and then separated by class in Figures 19b and 20b, where it can be seen that photons and electrons are the particles that deposit the highest dose rate followed by protons.
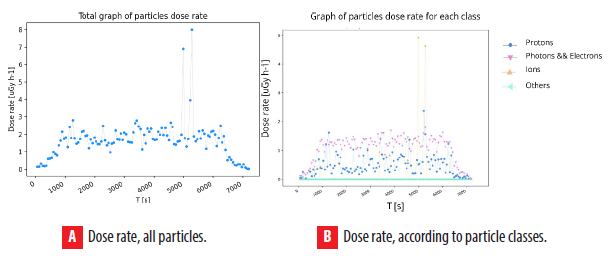
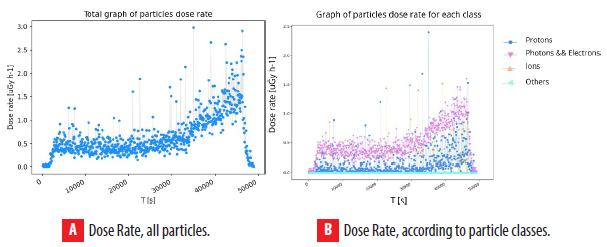
Generally, the dose rate in the first and last seconds of flight is expected to be low. In Figure 20 we can see a small variation in the last minutes of the flight, which can reflect changes in the flux of cosmic rays over long distances. Fluctuations of small duration, which can significantly increase the dose rate in a short time interval during the flight, also occur.
All flights
Figure 21 shows the dose rate of all particles for all flights described in Table 1.
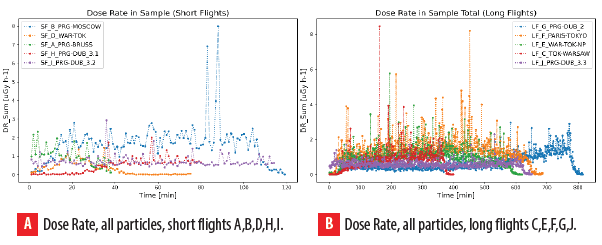
In general, the dose rate is low at ground level (at the beginning of the measurement) up to a few km altitude (data taken a few minutes after the plane took off ), and then it increases above 3 to 4 km, usually. In long flights, small variations (see blue data in Figure 21b), which can be interpreted as changes in the flux of cosmic rays over long distances, can be seen.
Dose
In contrast to the dose equivalent rate, whose calculation requires knowledge of the quality factor (QF) and LET (as was done in [5]), the total detected dose received during the measurement time can be calculated given the dose rate and the sampling time of each measurement. Table 7 shows the different flights with their detection time in hours, the average dose rate in (µGy/h), the calculated dose given in (µGy), and the standard deviation of each flight data. To compare the measurements as a function of altitude, two new data (Y, Z) have been added. The . label refers to the measurement on the ground (Prague) with the same detector as the previous flights, and the . label is the measurement in LEO orbit onboard Proba-V satellite [13], approximately at 830 km altitude. These data were obtained from Table 1 in [5] and Table 3 in [13], respectively.
| Label | Time (h) | Average Dose Rate (µGy/h) | Dose (µGy) | Standard Deviation |
| A | 0.65 | 1.02 | 0.66 | 0.53 |
| B | 2 | 1.65 | 3.3 | 1.06 |
| C | 6.68 | 0.8 | 5.33 | 0.66 |
| D | 1.27 | 0.32 | 0.4 | 0.34 |
| E | 10.35 | 0.97 | 10.06 | 0.58 |
| F | 11.45 | 1.34 | 15.39 | 0.75 |
| G | 13.6 | 0.65 | 8.88 | 0.46 |
| H | 1.35 | 0.48 | 0.65 | 0.4 |
| I | 1.9 | 0.73 | 1.38 | 0.31 |
| J | 10.88 | 0.59 | 6.44 | 0.22 |
| Y | 2 | 0.06 | 0.12 | |
| Z | 1 | 3360 | 3360 |
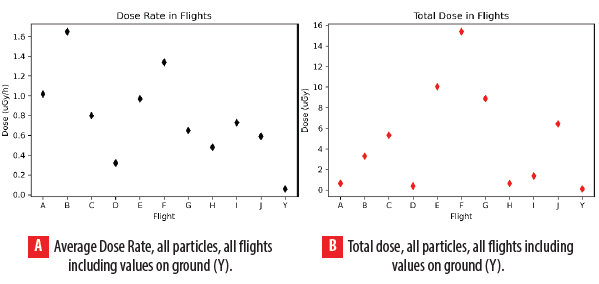
We can observe how the ground values (Y) in a 2-hour interval are almost 4 times lower than the lowest dose measured at flight altitudes. On the other hand, the dose given by the satellite in one hour at approximately 820 km altitude is more than 200 times higher than the highest dose measured in flight. It is also important to note how the total dose varies with respect to the dose rate depending on the exposure time. Although Figure 22a shows that . flight is the one with the highest dose rate, as being a short flight, its total dose is not as significant as the dose of flight ., for example (see Figure 22b).
Linear-energy-transfer spectra
The Linear Energy Transfer (LET) is given by the ratio of the particle deposited energy (E) along its trajectory to the cluster path length (L) [14].
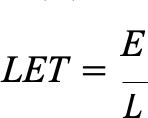 (3)
(3)The energy loss and particle LET were determined in the sensor material, in this case Silicon. According to their stopping power, particles can be grouped into low LET events (muons, energetic electrons, and X-rays) and high LET events (protons and heavy charged particles, fragmentation nuclear reactions with nuclei in the sensor volume). The event distributions, so called LET spectra, for all particles is shown in Figure 23.
The results show that most particles exhibit low-LET power, which is below about 1 (keV/µm), a range that corresponds to LCPs (electrons, X and γ rays).
DISCUSSIONS
In this work, a total of 10 operational flight altitude data, measured in the aircraft passenger section, wereused. Precise characterization, quantum sensitivity in terms of deposited energy, and visualization of thecharged particle radiation and X-ray field were performed by the semiconductor pixel detector Timepix operated in a miniaturized radiation camera MiniPIX-Timepix. Data processing was performed with an integrated SW tool (Data Processing Engine-DPE) provided by Advacam.
From the processed data, information including particle flux, deposited energy, dose rate and the equivalent deposited dose in the sampling time, field composition into broad particle classes (protons, electrons, X-rays), a detailed visualization of the radiation field, and quantum imaging registration of single particle tracks were obtained. To produce the graphs in this article, Python scripts provided by C. Granja, from ADVACAM, as well as original Python scripts were used.
Based on particle flux, particle classification, and event count rates, the observed incidence of events showed a sudden increase just after takeoff, probably due to the aircraft ascending. On the other hand, the decrease in particle count, in the final seconds of the flight, coincides with the descent to ground. For measurement G, a clear increase in the detection of charged particles was observed for a period of approximately 2 hours before landing, which may indicate different flight altitudes or variations in the cosmic ray flux at long periods of flight.
In terms of deposited energy, the results confirmed that photons and electrons made up the majorityof the particle counts. Energy distribution graphs for various particle types corroborate this result by showing that although protons and ions showed some sporadic energy peaks, they had a lower averageenergy deposition compared to photons and electrons. It is important to consider that, despite its scarcepresence, the cumulative deposited energy of protons and ions emerged as a significant contributor to thetotal deposited energy.
The dose outcomes showed higher doses in the time interval after takeoff and before landing. Small variations toward the end of flight G were also evident in the corresponding analysis. We compared the in-flight measurements with those taken on the ground (i.e., C. Granja and S. Pospisil, 2014 [5]) and by Prova satellite (i.e., C. Granja et al., 2016 [13]), from which it became evident that the dose rates during flight altitudes are substantially higher than the corresponding ground values. Furthermore, the satellite’s dose rate, measured at an altitude of approximately 820 km, is considerably greater than the maximum dose rate detected during flight.
It should be noted that the total dose fluctuates as a function of exposure time relative to the dose rate. As an example of this, we can see that although flight B presented the highest dose rate among all measurements, having a relatively short flight duration, it resulted in a less significant accumulated dosecompared to flights such as F or E, which despite having a lower dose rate, accumulate a substantial totaldose due to their long duration.
As future work, an analysis with directional fluxes using the directional information from the detector will be considered.
Acknowledgments
This work was made possible thanks to Carlos Granja, who collected the data using the radiation camera MiniPIX-Timepix from Advacam, Prague and guided us in the methods and data processing of this work. Special thanks to Edgar Carrera, from Universidad San Francisco de Quito USFQ, for providing valuable comments that helped shape this article into its final version. The research was performed in the framework of the CERN Medipix Collaboration.
REFERENCES
[1] F. Spurny´ et al. (2007). Monitoring of onboard aircraft exposure to cosmic radiation: May–December 2005. Advances in Space Research, 40(11), 1551–1557. doi: https://doi.org/10.1016/j.asr.2006.10.006
[2] R. Beaujean et al. (2005). Radiation exposure measurement onboard civil aircraft. Radiation Protection Dosimetry, 116, 1-4. doi: https://doi.org/10.1093/rpd/nci095
[3] 1990 Recommendations of the International Commission on Radiological Protection. (1991). Annals of the ICRP, 21(1-3), 1–201.
[4] J.B.L. (2005). Jones et al. Space weather and commercial airlines. Advances in Space Research, 36(12), 2258–2267. doi: https://doi.org/10.1016/j.asr.2004.04.017
[5] C. Granja and S. Pospisil. (2014). Quantum dosimetry and online visualization of X-ray and charged particle radiation in commercial aircraft at operational flight altitudes with the pixel detector Timepix. Advances in Space Research, 241–251. doi: https://doi.org/10.1016/j.asr.2014.04.006
[6] T Poikela et al. (2014). Timepix3: a 65K channel hybrid pixel readout chip with simultaneous ToA/ToT and sparse readout. Journal of Instrumentation, 9(5), C05013. doi: https://doi.org/10.1088/1748-0221/9/05/C05013
[7] C. Granja; C. Oancea et al. (2021). Wide-range tracking and LET-spectra of energetic light and heavy charged particles. Nuclear Instruments and Methods in Physics Research Section A: Accelerators, Spectrometers, Detectors and Associated Equipment, 988, 164901. doi: https://doi.org/10.1016/j.nima.2020.164901
[8] C. Granja; K. Kudela et al. (2018). Directional detection of charged particles and cosmic rays with the miniaturized radiation camera MiniPIX Timepix. Nuclear Instruments and Methods in Physics Research Section A: Accelerators, Spectrometers, Detectors and Associated Equipment, 911, 142–152. doi: https://doi.org/10.1016/j.nima.2018.09.140
[9] C. Granja; J. Jakubek et al. (2018). Resolving power of pixel detector Timepix for wide-range electron, proton and ion detection. Nuclear Instruments and Methods in Physics Research Section A: Accelerators, Spectrometers, Detectorsand Associated Equipment, 908, 60–71. doi: https://doi.org/10.1016/j.nima.2018.08.014
[10] C. Granja; J. Jakubek; et al. (2022). Spectral and directional sensitive composition characterization of mixed radiation fields with the miniaturized radiation camera MiniPIX Timepix2. Journal of Instrumentation. doi: https://doi.org/10.1088/1748-0221/17/11/C11014
[11] ADVACAM. (2023). DPE. URL: https://wiki.advacam.cz/index.php/DPE.
[12] J.W. Poston. (2003). Encyclopedia of Physical Science and Technology. https://www.sciencedirect.com/referencework/9780122274107/encyclopedia-of-physical-science-and-technology
[13] Carlos Granja et al. (2016). The SATRAM Timepix spacecraft payload in open space on board the Proba-V satellite for wide range radiation monitoring in LEO orbit. Planetary and Space Science, 125, 114–129. doi: https://doi.org/10.1016 /j. pss.2016.03.009
[14] Carlos Granja et al. (2021). Wide-range tracking and LET-spectra of energetic light and heavy charged particles. Nuclear Instruments and Methods in Physics Research Section A: Accelerators, Spectrometers, Detectors and Associated Equipment, 988, 164901. doi: https://doi.org/10.1016/j.nima.2020.164901
Author notes
mariadelcarmensalazar1980@gmail.com

