SECCIÓN A: CIENCIAS EXACTAS Y FÍSICAS
Numeric simulation and experimental validation for a Novel Trapezoidal Solar Collector
Numeric simulation and experimental validation for a Novel Trapezoidal Solar Collector
Avances en Ciencias e Ingenierías, vol. 16, núm. 1, e2823, 2024
Universidad San Francisco de Quito
Recepción: 06 Octubre 2024
Aprobación: 16 Diciembre 2024
Abstract: In a global warming context, the diversification of the energy matrix is essential for mitigation. Solar devices have begun to play an important role in this sense, flat-plate solar collectors being the most practical device. On the other hand, numerical modeling and experimental validation are important tools for improving the performance of these technologies. In this work, a trapezoidal solar air heating collector for food drying processes was modeled by using the Simusol open-access software, and experimental validation was performed. This particular shape presents a geometrical novelty since no other similar designs were found in the available literature, even in such an application as food drying. Key parameters, such as air temperature, global efficiency, air mass flow, global heat loss coefficient, and useful heat, are determined and discussed. The proposed air collector numerically behaves as expected. The output air temperature reaches about 100 °C, while the peak heat gain is about 900 W, which makes the air heating collector suitable for drying applications. Due to natural convection being the main heat transferring mechanism, low air mass flows were obtained. For the case analyzed here, this last parameter ranges from 0.012–0.016 kg/s for the optimal thermal behavior. The numerical model developed is a reliable tool for designing thermal technologies without extra capital cost; the increase of collecting area leads to a considerable increase in the thermal power output and improves the psychrometric conditions of heated air.
Keywords: Solar air heating, trapezoidal collector, computational simulation, experimental validation, Simusol software, thermal behavior.
Resumen:
En el actual contexto de calentamiento global, la diversificación de la matriz energética es fundamental para la mitigación. Las tecnologías solares han comenzado a desempeñar un papel importante en este sentido, siendo los colectores solares de placa plana los más prácticos. Por otro lado, el modelado numérico y la validación experimental son herramientas importantes para mejorar el rendimiento de estas tecnologías. En este trabajo, se modeló y validó experimentalmente un colector de aire solar trapezoidal para procesos de secado de alimentos utilizando el software de código abierto Simusol. Esta forma particular se presenta como una novedad geométrica, ya que no se encontraron otros diseños similares en la literatura disponible, ni siquiera en aplicaciones como el secado de alimentos. Se determinan y discuten parámetros clave, como la temperatura del aire de salida, la eficiencia global, el flujo de masa de aire, el coeficiente global de pérdida de calor y el calor útil. Los resultados numéricos del comportamiento del colector fueron los esperados. La temperatura del aire de salida alcanza unos 100 °C, mientras que la ganancia máxima de calor es de unos 900 W, lo que hace que el colector solar sea adecuado para aplicaciones de secado. Debido a que la convección natural es el principal mecanismo de transferencia de calor, se obtuvieron bajos flujos de masa de aire. Para el caso analizado aquí, este último parámetro oscila entre 0,012 y 0,016 kg/s para las condiciones óptimas de funcionamiento. El modelo numérico aquí presentado resulta en una herramienta fiable para el diseño de tecnologías térmicas sin coste adicional de capital. El aumento de la superficie de captación conduce a un aumento considerable de la potencia térmica de salida, así como mejoras en las propiedades psicrométricas del aire calentado.
Palabras clave: calentamiento solar de aire, colector trapezoidal, simulación computacional, validación experimental, programa Simusol, comportamiento térmico.
BACKGROUND
Solar energy has been considered the main source of renewable energy in the last years [1]. In this sense, technologies and solar devices have begun to play an important role in the global warming and climate change context [2]. The implementation of solar energy-based technologies, at all scales, promotes a decrease in both fossil fuel consumption and greenhouse gas emissions [3,4]. In the field of solar thermal energy, flat plate collectors are one of the most widely used technologies due to their easy construction and operation [5]. They are heat exchangers that transform solar radiation into thermal energy [6,7]. Solar air heating collectors (SAHC) are the most widely used devices due to their simple design, although their efficiency is lower than that of solar water heating collectors [8]. However, new designs are continuously being proposed to increase their thermal performance and obtain more compact and lighter devices [9- 12]. Since the SAHC are used in multiple applications, they can be assembled in various ways in terms of their configuration and constituent materials [13].
Numerical modeling combined with experimental validation has been widely implemented as a strategy for design optimization of air heating collectors [14-19]. However, several authors have studied the SAHC by focusing on theoretical/numerical development. Zulkifle [8] evaluated two types of covers—glass and Fresnel lens—on a v-groove SAHC and studied the influence of each cover in terms of heat transfer, pressure drop, output temperature, and thermal efficiency. The theoretical and numerical approaches were established using Excel software. These authors reported higher efficiency for a collector covered with Fresnel lens than for those covered with glass,
71.18 % vs. 54.10 %, respectively. Moreover, the mass flow rate contributed to efficiency enhancement. Bhattacharyya [20] determined by numerical simulation the optimum number and dimension of rectangular fins in a single-pass SAHC for two different fin thicknesses. The design and optimization of the SAHCs were carried out using the Computational Fluid Dynamic Model. Qui Lin [21] made a numerical simulation of SAHC with a perforated metallic plate by using a ray-tracing solar load model and obtained the
temperature and velocity distribution on the plate collector. Hernández [22] developed an analytical model to assess the thermal performance of three different collectors: single-pass, double-pass, and double-flow. A robust formulation was elaborated, based on the local energy balance, which made it possible to obtain the efficiency plots for collectors, as well as the input/output temperatures. Other important parameters, such as heat removal factor, convective coefficients, useful heat gain, and global loss coefficients, were formulated. The best thermal behavior was revealed for a double-pass collector, with an optical efficiency of up to 60 % and a peak output temperature of 46.4
°C. This behavior is related to better heat transmission when both upper and bottom air fluxes are opposite.
More advanced numerical simulations can be found in the literature for solar collector optimizations. For example, Zhang et al. [23] have developed a neuronal network to optimize a water heating solar collector. In this study, nanoparticles were added to the heat transfer fluid with different molar fractions and room temperatures, and the performance analysis revealed that thermal conductivity and viscosity could be predicted with an acceptable accuracy, but neuronal networks need to be trained. Nanoparticles improve the thermal efficiency while the molar fraction increases. The numerical optimization is also possible not only for a single solar device. Hajabdollahi et al. [24] studied different combinations for water heating solar collector piping. They implemented the fast and elitist non-dominated genetic algorithm to find the values of optimum design parameters such as bottom isolation, edge isolation, length of collector, width of collector, number of tubes, tube diameter, the number of collectors, and arrangement of collectors in the network. Fuel cost was also included in the analysis. This research concludes that an increase of 10% in the fuel cost yields a decrease in cost ratio by 4.75%. Secondly, an increase of 10% in the total solar energy incident on the collectors means a cost ratio decrease by 9.69% while efficiency increases by 0.0178%. Another research work of solar collectors includes phase change materials (PCM) in their optimization analysis. In this line, Abu-Hamdeh et al. [25] compared the energy efficiency between nanofluids containing paraffin wax/graphene and paraffin wax/graphene oxide phase change materials in flat plate solar collectors. Their results revealed similarities with Hajabdollahi et al. [24], in the sense that including nanoparticles, combined with PCM, increases thermal conductivity, and thus better performance is observed, with even higher values than pure paraffin.
Most authors validated their theoretical developments under laboratory conditions and experimental tests. Reichl [26] performed three-dimensional fluid dynamic simulations for SAHC, where the heat mechanisms of conduction, convection, and radiation were modeled in great detail. Their model was solved by the ANSYS FLUENT software. The experimental setup was carried out at the Test Lab Solar Thermal Systems of the Fraunhofer Institute for Solar Energy Systems (ISE) in Freiburg. The modeled collector was validated by comparison of the output temperature obtained under laboratory conditions. A high correlation was observed, and therefore, the simulation allowed the authors to predict other parameters, such as absorber temperature, heat transported to air, efficiency, and thermal losses. Badache [27] compared the performance of two types of unglazed thermal collectors with computational fluid dynamics through the FLUENT software. In this case, turbulences within the collector were considered with the Reynolds–Normalized Group (RNG) k–ε turbulence model [28-29]. The experimental tests were performed under a laboratory-
controlled environment, where the collector had a vertical position and the unglazed covering was, in fact, a metallic absorber on which the radiation from lamps impinged. This absorber had a certain number of slots, and the air circulation was forced through them. Both numerical and experimental results were focused on thermal efficiency, combining three mass fluxes with two radiation values and two different plenums. A higher correlation of results with a higher mass flow was observed, while radiation and plenum thickness variations had no substantial influence on efficiency.
The validation of numerical models by experimental investigations under real solar conditions is more valuable than that conducted in the laboratory [3,30-34]. Esmalie [14] developed a complete energy model of a SAHC to predict the air output temperature and velocity profiles and then compared the results with measured data. This comparison revealed an average difference of 3.5% and 1.5% between predicted and measured output air temperature in natural and forced convection, respectively. These values were lower than the results obtained in previous studies, which included error percentages in a range from 4% to 10%. Mustafa and Mustafa
[28] performed the numerical simulation of a quarter-circle-shaped SAHC using ANSYS-FLUENT, and a mesh model was created with GAMBIT. They considered viscous properties and turbulence and implemented the RNG k–ε model to predict and visualize heat transfer and flow field throughout the SAHC. The validation of numerical results was performed with the experimentally measured data, with a reasonable correlation when the air flow temperature difference was plotted against the collector radius. Hernández [30] implemented the Gauss-Seidel iterative method for equation solving. This method allowed them to design and evaluate the thermo- energetic behavior of SAHC with a flat or V-corrugated absorber plate and a porous matrix. Higher air temperature and efficiency are possible due to this porous matrix incorporation. For the validation of their numerical model, both the inlet and outlet air temperatures were measured with K-type thermocouples, and the useful heat gain was compared. This comparison demonstrated a high correlation between numerical and experimental results for four winter days with maximum differences below 3 °C, while the useful heat gain ranged, peaking at 1200 W.
INTRODUCTION
The work presented here is supported by an academic project for developing a solar dehydrator of tropical fruits and vegetables. The aim of this article is to test how the proposed SAHC operates under different sky conditions, by both experimental and numerical analyses of the thermal performance, following the described methodology in Fig. 1. The solar energy gain takes place in a trapezoidal-shaped SAHC. This particular shape presents a geometrical novelty since no other similar designs were found in the available literature. In comparison to a rectangular-shaped collector, the air velocity increases along the inner channels from the bottom to the top of the collector. On the other hand, the construction of a trapezoidal SAHC could require more complex techniques than solar collectors available in the market. Furthermore, as the collector studied here has bigger dimensions than common ones, its transportability to the emplacement place is more difficult. These technical issues make the trapezoidal SAHC less attractive to be proposed, built, and mounted. This particular shape was selected
because it was designed to be implemented in tropical regions where environmental humidity could be greater than other locations. The additional collecting area also improves the psychrometric properties of the air, mainly its moisture absorption capacity and specific enthalpy.
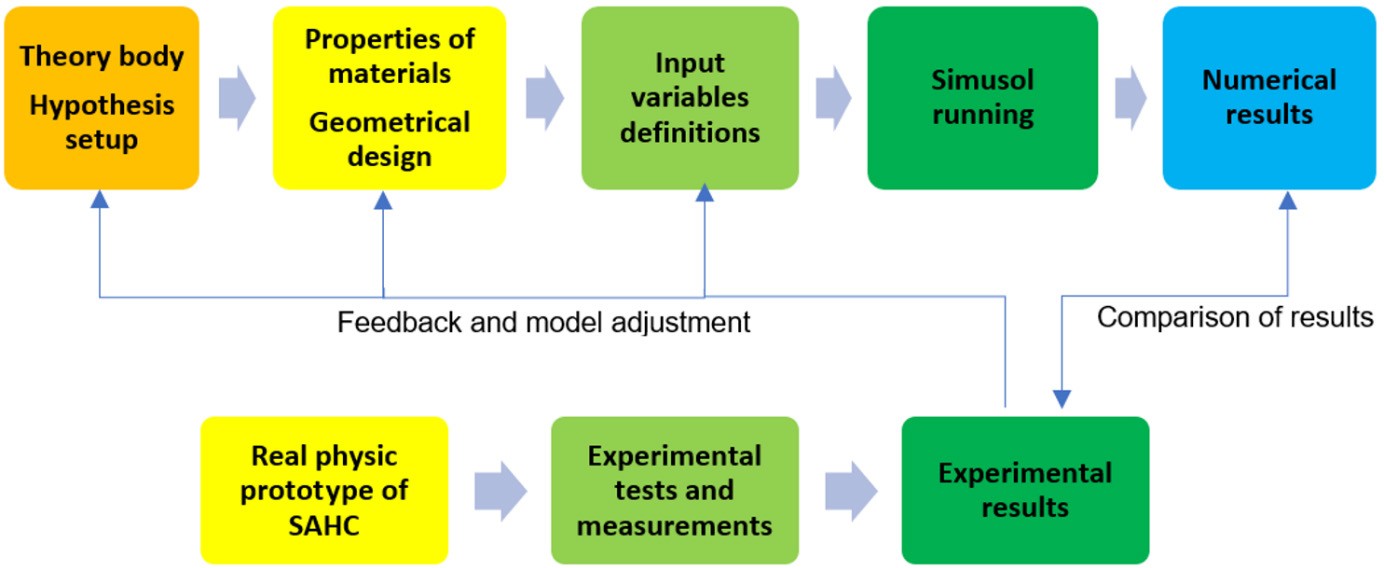
Figure 1.
Scheme of followed methodology for both numerical simulation and experimental validation.
The SAHC thermal model proposed here is based on natural convection as the main heat transfer mechanism for the air heating process. It is developed using a relatively new free software, called Simusol [35], to determine its thermal behavior, taking into account its geometrical shape, size, and construction aspects. Key parameters, such as air temperature, global efficiency, air mass flow, global heat loss coefficient, and useful heat, are determined and discussed. The validated model will allow the study of the thermal performance of the collector under different climatic conditions. Even more, a simulation of a rectangular-shaped SAHC with the same thermal model is presented in this work to compare differences in results between both technologies.
CASE OF STUDY DESCRIPTION
Fig. 2 shows the analyzed trapezoidal SAHC. The dimension of the collection area is 2.44 m x 1 m wide (bottom length and top sides, respectively) and 1.9 m length. See Fig. 2a. The total trapezoidal area of collection is 3.3 m2. The total inner height is 0.1 m, and the cross section decreases along the collector length. Therefore, the inlet area of the flow is 0.244 m2 and the outlet area is 0.1 m2. This configuration influences air circulation by increasing air velocity as the area decreases.
The covering surface is made of 0.006 m thick alveolar polycarbonate, which was considered as a homogeneous mass into the physical model, and the internal solar reflection effect was dismissed. The external case is made of 0.001 m galvanized steel sheet, and its mass was also dismissed in the model. Additionally, the lateral walls and the bottom of the collector had a 0.05 m fiberglass layer. See Fig. 2b.
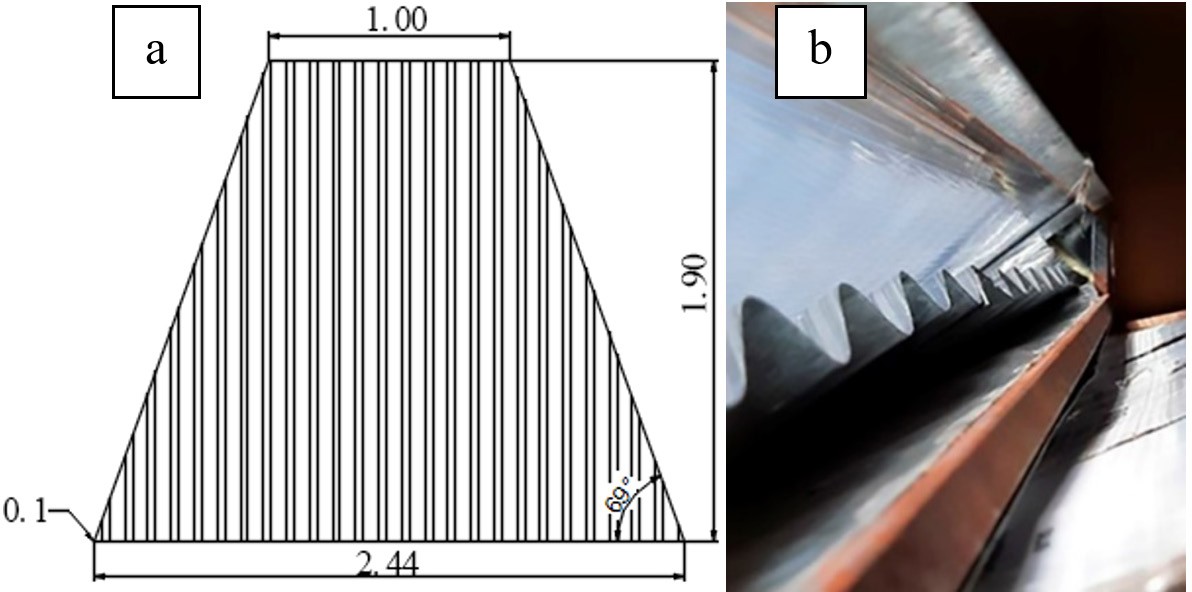
Figure 2
A Scheme of the trapezoidal SAHC and its external dimensions in meters B Inside view of the solar collector output to be connected into a drying chamber
Figure 2. (A) Scheme of the trapezoidal SAHC and its external dimensions in meters. (B) Inside view of the solar collector output, to be connected into a drying chamber.
The absorber plate is 1 mm-thick, black-painted sinusoidal galvanized steel. However, the absorber was considered as a plane plate, and its thermal conductivity was neglected in the model. The disposition of the absorber plate leads the air circulation into upper and bottom channels. The assumed thermal properties of the materials used in this work are shown in Table 1.
Table 1. Properties of the materials
Property Absorber Covering Case Isolation
| Density ρ (kg/m3) | 7.850 | 1.200 | - | 14 |
| Conductivity λ (W/m ºC) | - | 0.2 | - | 0.03 |
| Absorptivity α (-) | 0.96 | - | - | - |
| Transmittance τ (-) | - | 0.8 | - | - |
| Emissivity ε (-) | 0.8 | 0.9 | 0.1 | - |
PHYSICAL AND MATHEMATICAL MODEL
The following hypotheses were considered to formulate the model:
• The air circulation inside the channels is unidirectional, in the input-output direction. In practice, it is favored by the sinusoidal shape of the absorber.
• The roughness of the internal walls is neglected. Under this hypothesis, a uniform air velocity profile for each cross section was assumed.
• Transient disturbances of external wind velocity are not considered.
• The internal multiple reflection effect inside the covering plate is neglected here since there are no precise models related with honeycomb polycarbonates to represent this effect in the literature.
• The thermo-physic properties (thermal conductance, absorbance, and reflectance) are considered as unchanging and the composition of materials homogeneous.
• All the heat fluxes are considered unidirectionally.
• The psychrometric properties of the air nodes (absolute and relative humidity) are not considered at this stage of simulation.
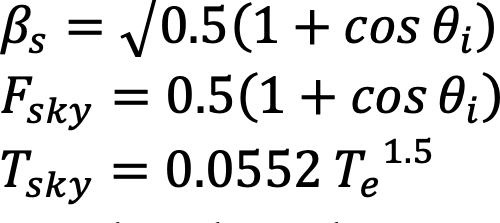
• The spectral solar transmittance of the polycarbonate covering layer is considered as a constant value of 0.85, and its dependence on solar incidence angle is dismissed.
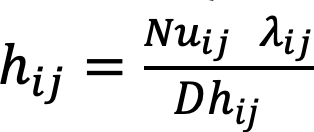
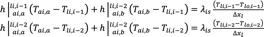
The thermal energy is transferred from the collecting plate to the circulating air by heat convection as the main mechanism [6]. Then, radiative and conductive transmissions are also considered. The air circulation takes place both below and above the absorber plate. This configuration facilitates improvements in the performance of the heat collecting process [22,36]. Hourly measured climatological variables, such as wind speed, solar radiation, and environmental temperature, were considered as boundary conditions. The outer convective coefficients were calculated based on the methodology described by Duffie and Beckman [6]. Fig. 3 shows the physical model implemented in the simulation. In this model, the air temperatures are represented by nodes: one of them located between the plate and the covering surface, and the other one between the plate and the bottom surface. The transmitted solar radiation (Iτ) impinges on the absorber, and part of it is absorbed as thermal energy (Iτα), which is partially transferred to the air nodes by convection. The thermal transmission between these air nodes and lateral inner walls is also considered. Thermal conductive mechanisms through the isolation case and the cover are taken into account. Three thermal losses take place in this model: upper (covering surface), lower (bottom surface), and lateral. The boundary conditions on the outer and inner surfaces also include the effect of thermal radiation and convection.
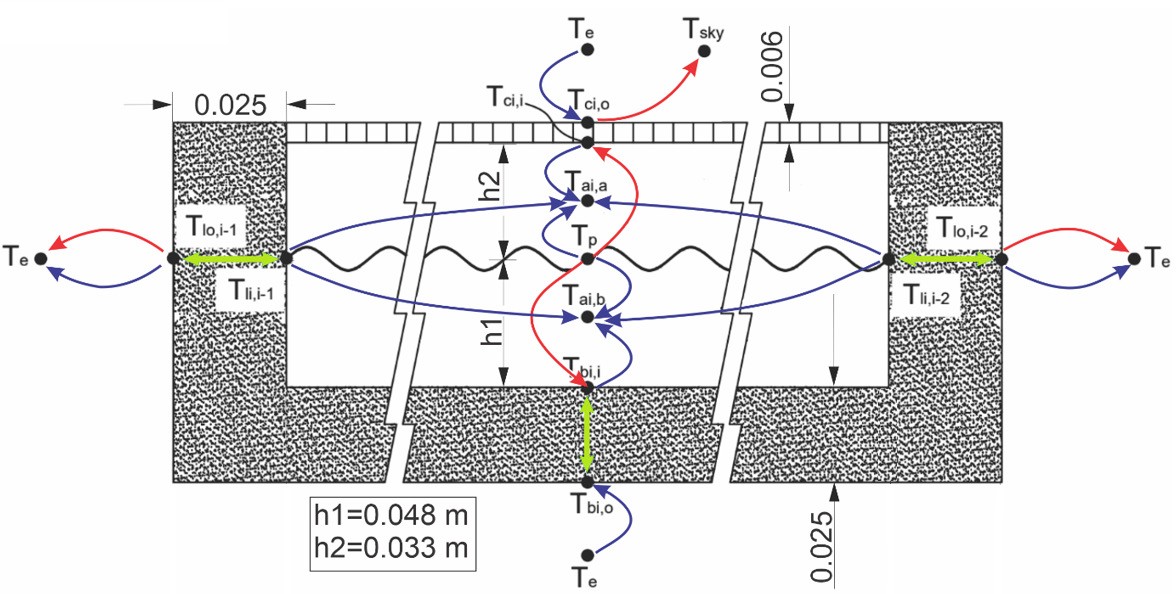
Figure 3.
Scheme of temperature nodes and thermal transmission circuits, for an arbitrary transversal section considered, where dimensions are in meters. The colors for the different heat transmission mechanisms are: red for irradiative, blue for convective, and green for conductive.
The ribbed shape of the plate is not considered in the model because of its quasi-flat shape. A different case occurs when the absorber has a pronounced irregular form, as noted by Zulkifle [8] and Bashria [37]. Nusselt number conditions for laminar flow, transition, and turbulent flow regions must be treated differently. Nevertheless, in the present design, the transversal areas where air flows can be considered rectangular, without much error. The equations for thermal calculus are described below [38,39].
(1)
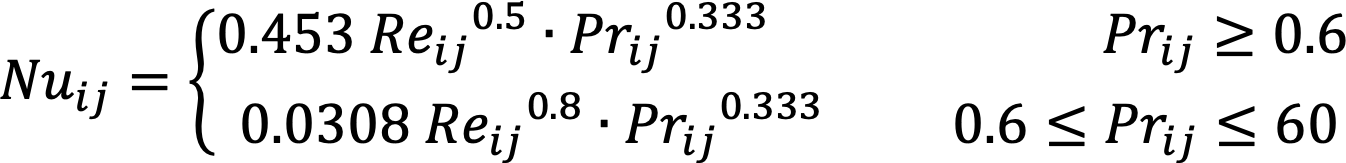
(2)
(3)
The temperature dependence of Prandtl (Pr), dynamic viscosity (μ), and conductivity coefficient (λ) are implemented within the program by tables. The values for these parameters were taken from Bergman (2011). A similar consideration was reported by Zulkifle [8] and Bashria [37], but they implemented formulas related to air temperature, instead of discrete values.
As the collector was modeled by dividing the equipment into three sections, subscript i refers to each transversal discrete section of the collector while subscript j refers to each convective and radiative coefficient within the same section. Each section is connected to the others by the air flow mass, as shown in Fig. 4. B1-3 and D1-3 nodes represent the temperature of circulating air above and below the absorber plate, respectively. The air mass flow through the collector is the same, but since the transverse section has a linear decrease, the air velocity increases while the air rises through the collector. H1-3 and L1-3 represent the inertial capacitance of the circulating air. The temperature nodes ss and si represent the output air temperature for both upper and bottom channels, respectively. Convection was modeled between these nodes and the environmental temperature node, according to Iriarte [40]
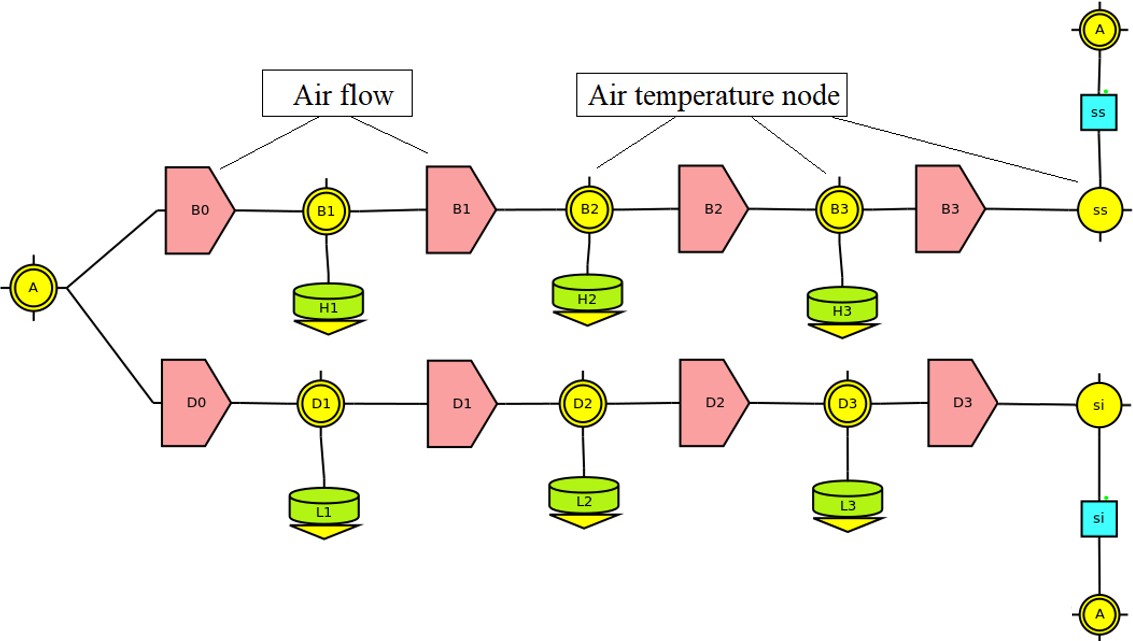
Figure 4.
Model representation of air mass flow through the collector. B0-3 and D0-3 correspond to the air flow above and below the absorber plate, respectively.
Boundary conditions
For any section, the mathematical boundary conditions for the calculation domain are given as:
• Covering surface
This surface is exposed to the outer conditions. Convection and radiative transmissions are the heat transfer mechanisms. The aperture area is made of honeycomb polycarbonate and modeled as single thermal conductance with a transmission coefficient of λp=3.6 (W/m2 °C). Eq. 4 gives the energy balance for the solar collecting surface.

(4)
(5) (6) (7)
A bsorber plate
The absorber is a black painted metallic surface, where solar radiation is partially absorbed and the temperature of the plate rises. The energy balance is given by Eq. 8, where thermal conduction through the metallic surface was neglected due to its thinness.

(8)
Bottom surface
The air circulation below the absorber transmits part of its thermal energy to the bottom surface by convection, and then by conduction through the bottom isolation layer to the outer surface. For any section of the collector, Eq. 9 introduces the thermal condition boundary for the bottom surface, where the conduction of the metallic internal case is neglected due to its thinness.

(9)
Lateral inner and outer walls
The thermal losses through the lateral walls of the collector were also considered in this model. Only the convective mechanism is considered here, for both bottom and upper channels:
(10) (11)
Then, the heat throughout the walls is transferred to the external atmosphere by convective and radiative mechanisms (Eqs. 12 and 13).
(12) (13)
Thermal performance
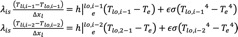
By definition [6], the thermal loss represents the energy that is not transferred to the heat carrier fluid (HTF), and this energy goes to the atmosphere. A global thermal loss coefficient is defined in terms of convective, conductive, and radiative coefficients. It is also possible to calculate the thermal losses through the top, bottom, and lateral walls separately (Eqs. 14, 15, and, 16 respectively).
(14) (15) (16)
Heat fluxes, and are calculated by Simusol as conductive losses, and their values can be obtained by simply requesting the simulation results from the software program. Eq. 17 gives the global heat loss coefficient [6].

(17)
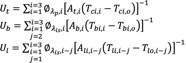
The collector’s useful energy gain and the global efficiency are calculated by means of Eqs. 18 and 19, respectively.

(18)

(19)
Both air-mass flows m˙a and m˙b are determined by instantaneous thermal balance at air temperature nodes B1 and D1, respectively [40].

(20)
(21)
So, the total air mass flow results in:

(22)
The convective fluxes and are calculated by Simusol and repr esent the thermal gain from the absorber, lateral walls, covering, and bottom surface into respective air flow nodes, as Fig. 5 shows.
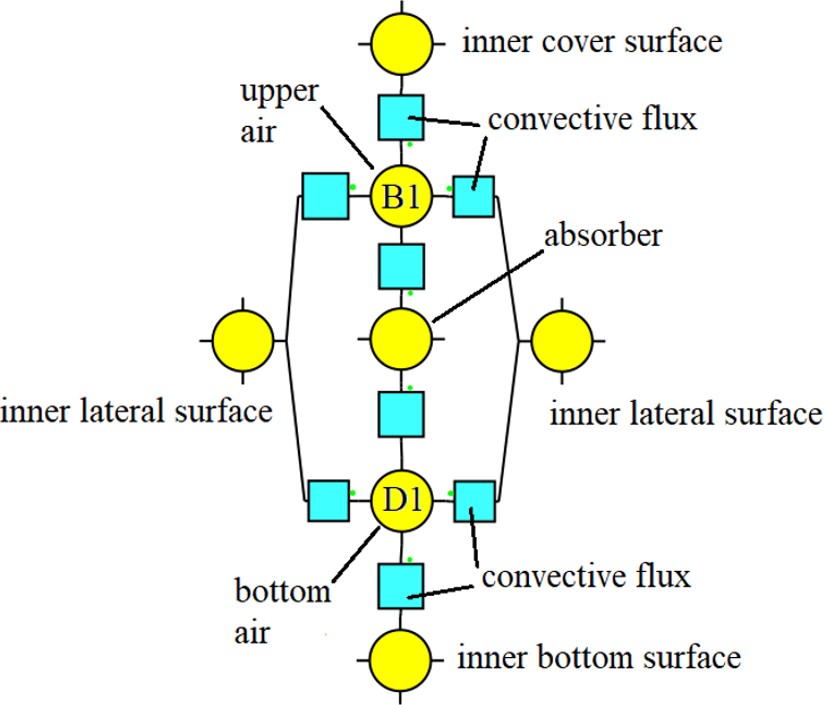
Figure 5.
Scheme of convective fluxes into air flow nodes, for the first section of the SAHC
SIMULATION RESULTS
Simusol generates a spreadsheet with a 7 s time-step for each parameter. It also shows a set of time-dependent variables upon request; otherwise, Simusol shows the temperature profile for all the thermal nodes in the model. To perform the simulation, the model presented here requires some climatological data input: the solar radiation based on experimental measurements, the environmental temperature, and the wind velocity in the area surrounding the collector. This information is given by tables, and they can be repeated many times by a Prep command. It is also important to define the slope of the collector and the geometrical dimensions. Since Simusol runs on Linux, it can be launched in a user terminal from the folder where the .dia file is located, using the simusol command. It is important to save all changes made in the model before starting the simulation. Fig. 6 shows a diagram of the interaction between the thermal model, the climatological data entry, the thermal/optical properties of the materials, and the geometrical design parameters for upper and bottom channels. Differential equations are solved by the fourth-order Runge-Kutta method [41], which is a simple, robust, and suitable option for the numerical solution of differential equations combined with an intelligent adaptive step-size routine.
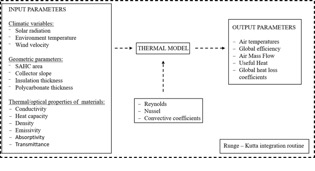
Figure 6.
Scheme of the thermal model implemented on Simusol.
Four days were selected to perform the numerical simulation, with mainly two types of days: clear and partially clouded. The aim was to reproduce the conditions of variability, as realistically as possible, with which the experimental SAHC must operate. Fig. 7 shows the temperature profile of the air flux in the upper channel. To simplify the graphs, a period from 9 a.m. to 5 p.m. was defined as the operating time of the SAHC.
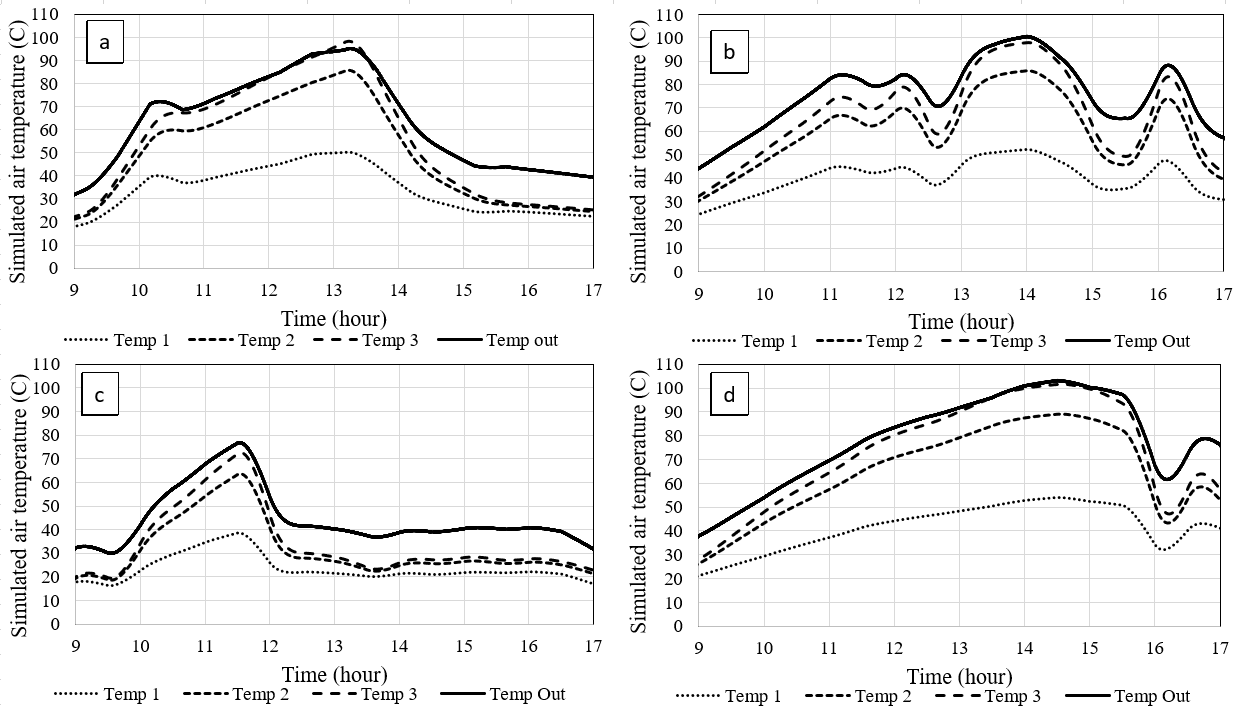
Figure 7.
Simulated air temperature for the upper channel. Temp 1 to 3 and Temp out correspond to nodes B 1 to 3 and temp ss in Fig. 3. (A) March 29, (B) April 6, (C) April 12, (D) April 15.
It can be observed that the output temperature of the upper air can reach about 100 °C. For some processes like food drying, this temperature could be higher than necessary but ideal for certain grains, seeds, and corn. However, this temperature value enables the SAHC to be applied to other processes with higher thermal demand. The high temperatures obtained here are strongly related to the high solar radiation values measured at the location and the additional collecting area due to the trapezoidal shape of the SAHC.
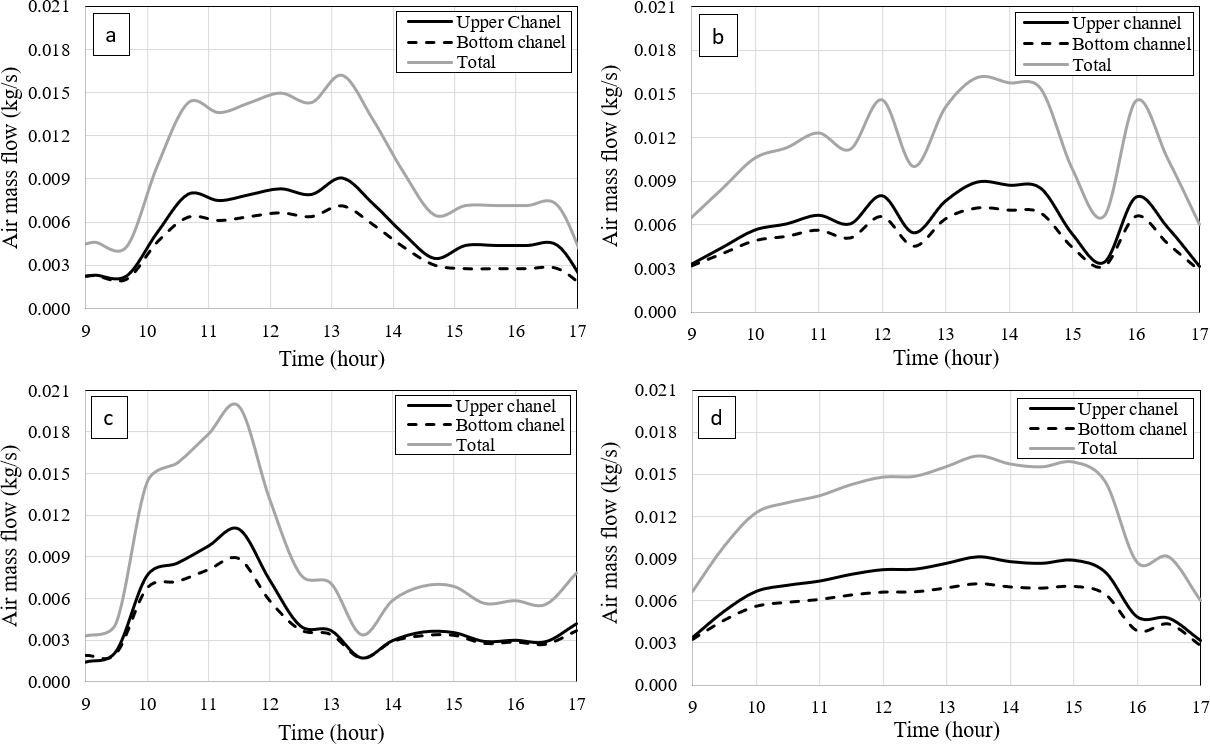
Figure 8.
Air mass flow profiles for both upper and bottom channels of the SAHC and total air mass flow. (A) March 29, (B) April 6, (C) April 12, (D) April 15.
Eqs. 20, 21, and 22 give the air mass flow in kg/s for both upper and bottom channels and the total air mass flow, respectively. The heat gain and the air temperature are important in establishing the air mass flow (Fig. 8). It can be observed that the air mass flow is different for each channel because of the different heat gains. The highest air mass flow corresponds to the upper channel, which means that the air velocity is the highest there. This numerical result was expected because the heat source (the absorber) is located under the air thermal node in the upper channel, while the same heat source is located above the air thermal node in the bottom channel.
The values of the total air mass flow range from 0.0015 kg/s to 0.02 kg/s. Other studies of SAHC yielded values of 0.019–0.028 kg/s [20], 0.017 kg/s [44], 0.013–0.04 kg/s [45], and
0.056 kg/s [46]. It is important to note that there are significant differences between the mentioned systems, such as the position and slope, the geometry, and the absorber shape and materials. Nevertheless, the air mass flows obtained here correspond to those normally obtained for this kind of technology.
The useful heat gain is determined by Eq. 18, which takes into account the air mass flows of both channels and the difference in output-input air temperatures. Here, the dependence on the temperature of the specific heat of the air was neglected. Fig. 9 shows the useful heat profiles for the four days considered. A maximum thermal power output of about 1200 W can be reached by the SAHC under study. The global efficiency is determined by Eq. 19, and Fig. 9 shows this parameter, where, in clear-sky conditions of operation, an average value of 35% is observed, in the hours around the midday, while efficiency varies on cloudy-sky days. Peaks of about 45% on global efficiency are reached by this SAHC.
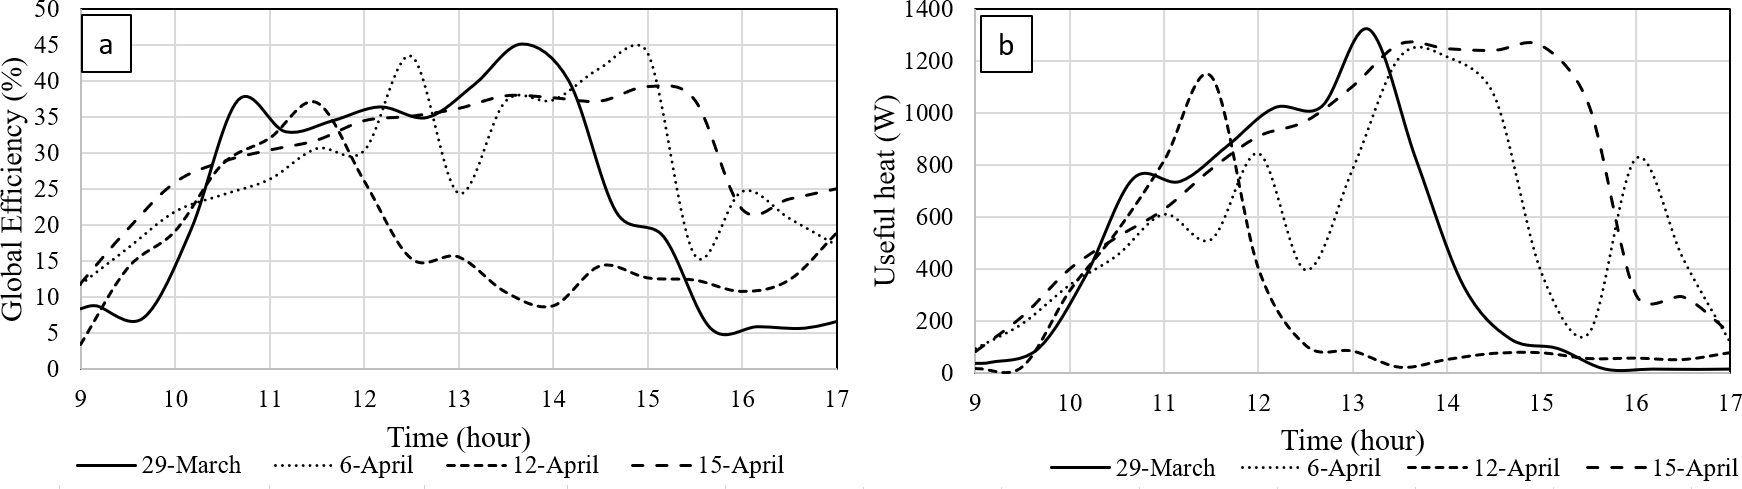
Figure 9.
(A) Global efficiency, and (B) useful heat gain.
One of the main parameters to be considered in describing the collector’s performance is the global heat loss coefficient, which is given by Eq. 17. In this model, the top, lateral, and bottom thermal losses were considered separately, and then the global heat loss was estimated. Fig. 10 shows the time variation of the total global heat loss coefficients for all the considered days. For the operating period, the global heat coefficient ranged from 16 to 18 W/m2 ºC. The literature reports a normal value of 10 W/m2 ºC [6] for a single covered air heating solar collector.
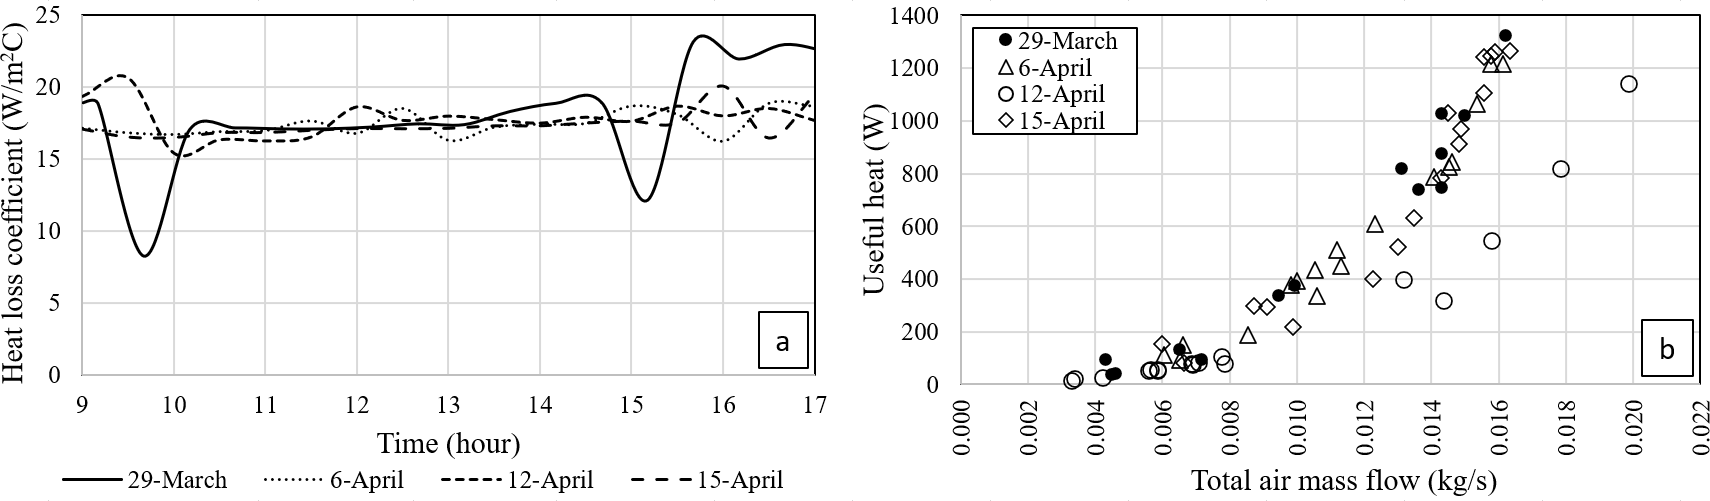
Figure 10.
A) Global heat loss coefficients. (B) Useful heat gain related to the total air mass flow.
Fig. 10 shows the range of air mass flow for the heated air production, considering the thermal power output of the SAHC. For optimal performance, the SAHC should operate in a range of 0.016–0.020 kg/s. This must be considered if a forced air circulation system is integrated into the SAHC.
EXPERIMENTAL SETUP
The trapezoidal SAHC location was -24.69 Latitude and -65.39 Longitude, and it was north-oriented with a fixed optimal slope of 36° for a homogeneous solar collection throughout the year. In order to replicate the real working conditions, the SAHC was connected to a drying chamber of 1 m3 volume, as shown in Fig. 11a.
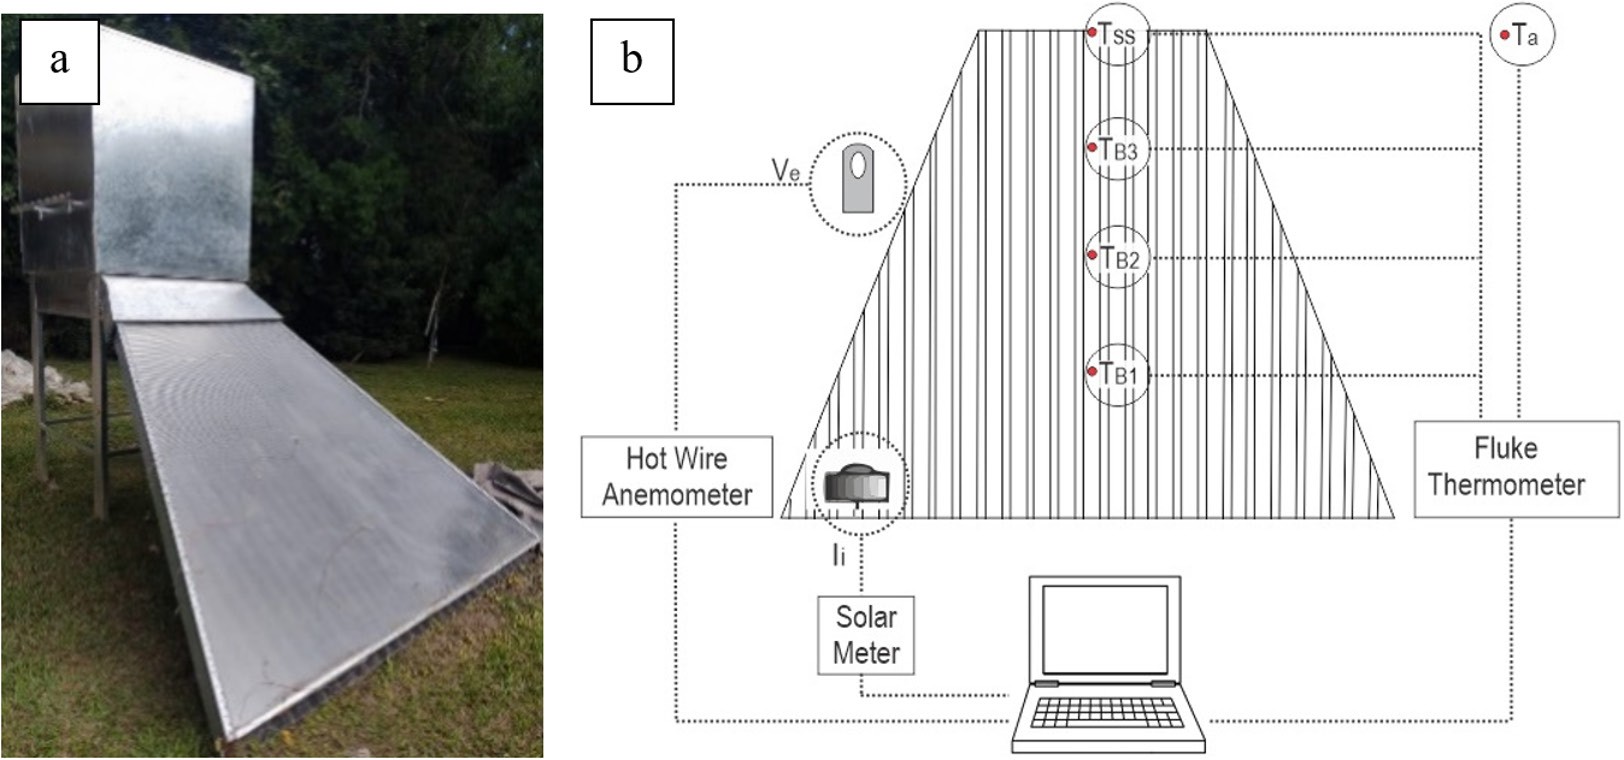
Figure 11.
(A) Trapezoidal SAHC connected to the drying chamber, in its working position. (B) Scheme of measuring devices used for data recording.
The solar radiation was measured with a solarimeter placed on the covering surface of the SAHC, as shown in Fig. 11.b. The air temperatures were measured according to the nodes in the simulation model: B1, B2, B3, and ss. It was only possible to place the temperature sensors in the upper channel of the collector. A thermometer Fluke 54 II with type-K thermocouples was used for measuring the temperature. The surrounding wind velocity was measured using a hot-wire anemometer. Table 2 briefly describes the used instruments.
| Parameter | Device | Accuracy |
| Temperature | Fluke 54 II thermometer with thermocouple K-type | 0.1 ºC |
| Wind velocity | Hot-wire anemometer TES 1341 | 0.01 m/s |
| Solar radiation | HT204 solar power meter | 1 W/m2 |
Experimental results
The temperatures of the circulating upper air were measured. As commented in the previous section, K-type sensors were used and the measuring procedure was carried out during the operative period of the SAHC, from 9 a.m. to 5 p.m. Although the ASHRAE code sets the conditions for testing the equipment [47], both clear-sky and cloudy-sky conditions were considered to make simulations under real operative situations. Fig. 12 shows the measured air temperatures for the upper channel. It can be observed that the air temperature peaks between 80 °C and 100 °C. As expected, the shape of the curves follows the solar radiation profile. This indicates that the SAHC has low thermal inertia, and it can quickly reach the thermal state of operation when the solar radiation has suitable values. Since drying processes require a temperature range of 50–60 °C [48] for optimal performance, the SAHC needs solar radiation between 600 W/m2 and 900 W/m2. For cloudy-sky conditions, with solar radiation of about 200 W/m2, the outer air temperature is about 35–40 °C. This represents an advantage because a reduced size of an auxiliary heat source is available, if necessary.
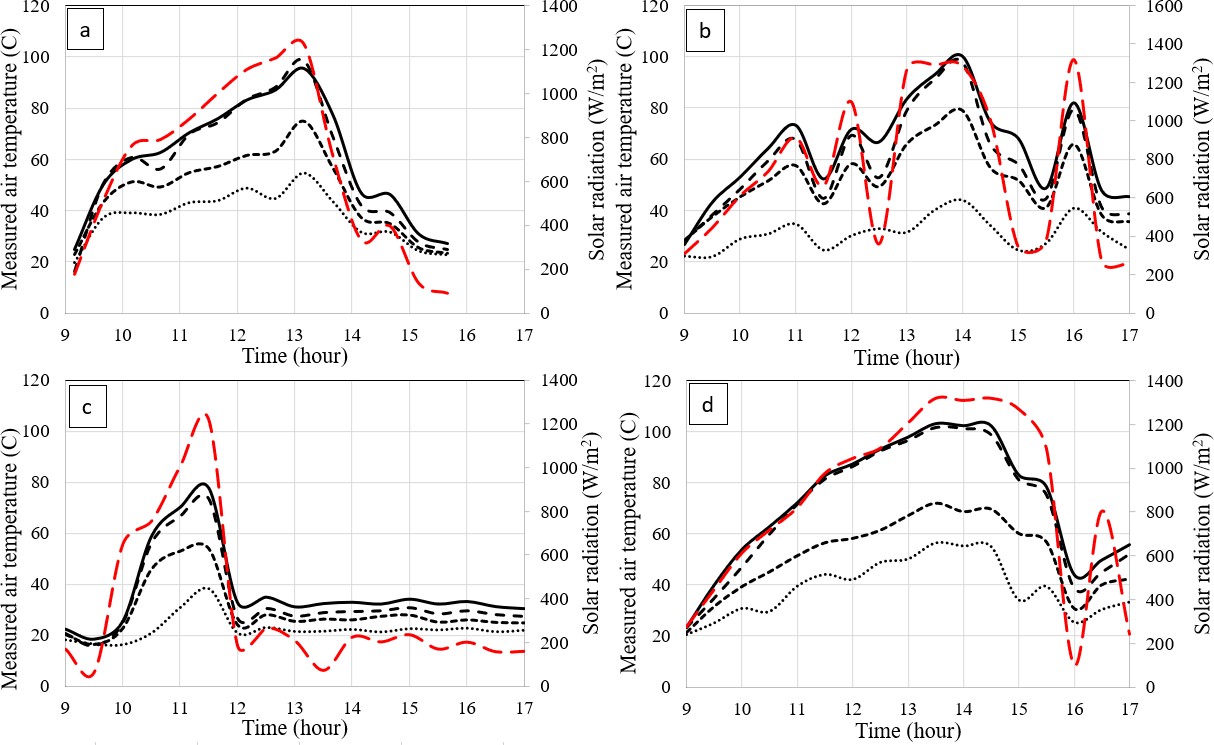
Figure 12.
Measured air temperatures in the upper channel. The Temp out plot corresponds to the ss node from the simulation. (A) March 29, (B) April 6, (C) April 12, (D) April 15.
The main reason for these differences is the weather input data values for every single day, referred basically to the solar radiation, environmental temperature, and surrounding wind velocity. It can be observed that the temperature response in the simulations coincides with the experimental measured one (every single plot in Fig. 7 compared with those in Fig. 12).
MODEL VALIDATION
The experimental and numerical results were compared (Fig. 13). Based on direct measurements, the air temperature for the upper channel was considered the main variable for performing the comparison. For the set of measured days, the determination coefficient R2 ranged from 0.82 to 0.93. The lowest correlation was obtained for a mostly cloudy day, where the predominant solar radiation was about 200 W/m2 after midday (April 12). This correlation can be considered acceptable despite the unstable working conditions. For a clear-sky condition, the correlation coefficient was 93%. Intermediate correlation values were observed for semi-cloudy sky conditions. The more stable climatic conditions, the better adjustment is achieved by the numerical model.
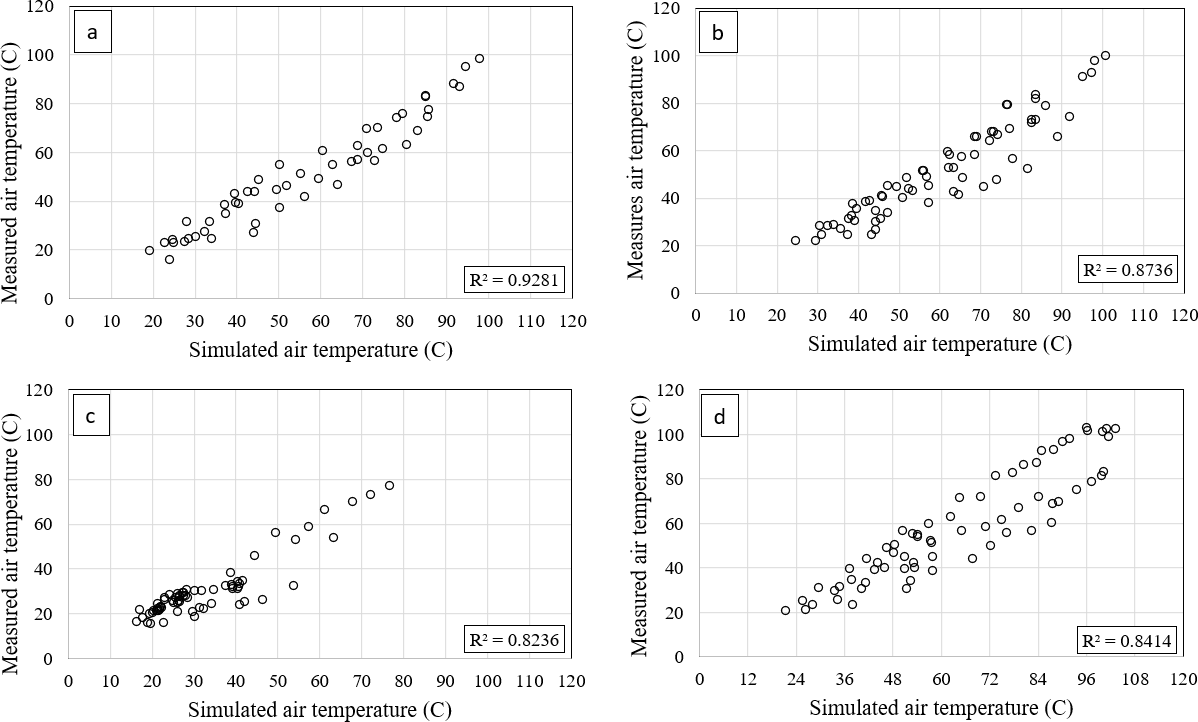
Figure 13.
Comparison between experimental and numerical air temperatures. (A) March 29, (B) April 6, (C) April 12, (D) April 15.
The scattering observed in Fig. 13 can also be explained by the surrounding wind variability when the measurements were performed (Fig. 14). As the SAHC studied here is a natural convective one, the oscillation of external wind produces variations in the external pressure near the inlet/outlet zones, influencing the air mass flow inside the SAHC, and therefore, the internal convective coefficients present high variability. Fig. 14 also shows a range of 0.1–3.4 m/s for wind velocity. This is a climatological feature of the region where the SAHC is mounted [49].
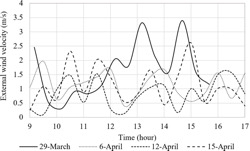
Figure 14.
External wind velocity surrounding the SAHC.
The reliability of the comparison was analyzed using Infostat software. In addition to the R2, other coefficients were determined. Table 3 shows the p-value, standard error (σ ),
mean absolute error (ε), asymmetry, and Kurtosis coefficients.
| Day | R2 (%) | p-Value | σx (ºC) | ε (ºC) | AsymmetryMeas. Sim. | KurtosisMeas. Sim. | ||
| 29th March | 92.81 | 0.0000 | 5.86 | 4.80 | 1.14 | 0.44 | -1.11 | -1.78 |
| 6th April | 87.36 | 0.0000 | 7.21 | 5.52 | 1.89 | 0.68 | -0.84 | -1.57 |
| 12th April | 82.36 | 0.0000 | 5.78 | 4.43 | 6.63 | 4.55 | 5.95 | 2.39 |
| 15th April | 84.14 | 0.0000 | 9.69 | 8.15 | 1.33 | 0.34 | -1.55 | -1.95 |
The results of the statistical analysis show a p-value lower than 0.05 for all cases, which indicates a statistically significant relation between the simulated and measured values, with a confidence level of 95%. As mentioned above, the model explains the correlation between the analyzed variables by an R2 higher than 80%, which indicates a good relation between variables. In general, asymmetry and kurtosis coefficients present values within a 2 – -2 range. This implies that the data sets have a normal distribution. However, it was observed outside the range values only for April 12. This significant deviation was caused by the high meteorological variation: solar radiation decrement combined with high external wind velocity.
DISCUSSION
The numerical results obtained in the present study are closely comparable with the results of other authors. The comparison of the main parameters is shown in Table 4. As mentioned in the introduction section, no one single case for trapezoidal collector was found in the
literature. While most of the designs were focused on thermal efficiency, with values above 60% (similar to vacuum pipes based-on collector) mostly reached, low thermal power outputs were reported. Additionally, the reported outlet air temperature was no higher than 71 ºC. This could be related to different parameters such as solar resource and sky conditions, orientation and disposition of collectors, sizes of solar absorber, materials used for prototype constructions, etc. The solar collector studied here reached higher temperatures and power thermal output, despite the fact that lower thermal efficiency was performed, compared with other works. This increase of air temperature and power thermal output was due to the extra area conforming the trapezoidal shape of the collector. Additionally, a numerical scenario as the SAHC built with rectangular shape was presented here. In this case, temperatures, efficiencies, and power outputs were similar to other authors. Furthermore, the comparison between both proposed models (trapezoidal and rectangular) revealed that better air heating conditions are easily achieved by simple modification in geometrical shape and collecting area expansion.
| Author | Technology | Airmassflow | Area | Tout | Efficiency | Usefulheat |
| Kareem et al., 2016 | Forced multi-pass solar dryer | 0.01-0.07 kg/s | 1.75 m2 | 55.49 ºC | 59.96 % | - |
| Li et al., 2011 | Vertical SAHC with aluminum perforated plate | 0.03 kg/s | 0.4 m2 | 16.4 ºC av. | 80-89 % | 202 W av. |
| Zhu et al., 2017 | V-shaped flat-plate SAHC with micro- heat pipe arrays | 0.054 kg/m2s | 1.8 m2 | 46.5 ºC | 69 % | - |
| Zulkifle et al., 2018 | V-grove with: a) single glass b) Fresnel lens | 0-0.09 kg/s | 1 m2 | a) 35.85 ºC b) 38.39 ºC | a) 47.10% b) 71.18% | - |
| Present study | Trapezoidal shaped SAHC | 0.0015-0.02 kg/s | 3.268 m2 | 103.5 ºC | 35% av. 45% max. | 1321 W max. |
| Present study | Rectangular shaped SAHC | 0.0015-0.013 kg/s | 1.9 m2 | 72 ºC | 21% av. 49.7% max. | 594 W max. |
CONCLUSION
A numerical model is proposed based mainly on a convective heat transfer mechanism. The air heat gain was modeled for both upper and bottom channels. This model differs from those of other authors in that the air temperatures are considered individual thermal nodes, so it is possible to determine each heat flux in the air nodes. Modeling based on convection as the predominant heat transfer mechanism made it possible to obtain reasonable numerical results and determine the most suitable materials for air heating applications. The numerical analysis of the trapezoidal-shaped SAHC considers the measured values of the solar irradiation that reaches the outer covering surface, as well as
the environmental temperature and external wind velocity. Two possible scenarios were considered to test the model proposed: clear-sky and cloudy-sky conditions. The numerical simulation was performed using an open-access software program called Simusol.
It was found that the SAHC can heat the air up to 100 °C. Moreover, lower temperatures can be obtained from lower solar radiation, of over 50 °C. The air mass flow ranged between 0.0015 and 0.02 kg/s, with an optimal range of 0.016–0.02 kg/s for the maximum heat gain (1140–1321 W). The numerical simulations revealed a satisfactory thermal performance for food drying applications and other low enthalpy processes. It is important to note that the trapezoidal-shaped SAHC studied here is a natural convective type and the obtained performance has advantages over similar technologies since an air forcing system is not needed, allowing energy savings. Although the achieved global efficiencies are not the main feature of the proposed design, 35% under stable operating conditions would be considered acceptable if the thermal performance (output temperatures, power thermal generation, and global heat loss) is taken into account.
The trapezoidal design of the collector increases the collecting area in a range of 1.8 to 8.2 times higher than the rectangular technologies found in the literature, without extra capital cost or initial investment and using the same constructive techniques. By increasing the collecting area, a considerable increase in the thermal power output was noted, despite the decrease in the global efficiency. Furthermore, Table 4 shows the numerical results for a rectangular SAHC with 1.9 m2 of collecting area (1 m width and
1.9 m length), which was simulated by using the validated model presented here and taking in consideration both the same climatic conditions and constructive materials as the trapezoidal one. It is observed that the output temperature remains about 100 ºC despite its poor global efficiency. Low useful heat is also observed for this rectangular configuration, and this could be explained due to the low air mas flow under natural convective conditions, suggesting the implementation of air forced systems to the designed SAHC in order to improve the thermal gain and the efficiency as well.
The modeling implemented in Simusol demonstrates once again that it is a reliable numerical tool for designing thermal technologies. Although the SAHC behaved as expected, more experiments are necessary to fine-tune the model. Additionally, a more accurate numerical description of the internal convective heat transfer mechanism could further improve the model. More accurate heat and mass transfer modeling will be done in the future, even with the drying chamber included in the model.
REFERENCES
[1] Petroleum, B. (2019). BP statistical review of world energy 2017. Statistical review of world energy, 65. https://www. connaissancedesenergies.org/sites/default/files/pdf-actualites/bp-statistical-review-of-world-energy-2017-full- report.pdf
[2] Gielen, D., Gorini, R., Wagner, N., Leme, R., Gutierrez, L., Prakash, G., ... and Renner, M. (2019). Global energy transformation: a roadmap to 2050. IRENA. https://fr.slideshare.net/wyakab/irena-global-energy-transformation-a- roadmap-2050
[3] Dellicompagni, P., Franco, J. and Flexer, V. (2019). Reducción de emisiones en la industria de litio en la Puna Argentina mediante tecnologías solares de concentración. Avances en Energías Renovables y Medio Ambiente, 23. https:// portalderevistas.unsa.edu.ar/index.php/averma/article/view/1172
[4] Ullah, F., Khattak, M. K., Kang, M., Li, N., Yang, J. and Wang, X. (2017). Numerical simulation on thermal performance of flat plate solar collector with double glass covers. Journal of Applied Sciences, 17(10), 502-510. doi: https://doi. org/10.3923/jas.2017.502.510
[5] Arunkumar, H. S., Karanth, K. V. and Kumar, S. (2020). Review on the design modifications of a solar air heater for improvement in the thermal performance. Sustainable Energy Technologies and Assessments, 39, 100685. doi: https:// doi.org/10.1016/j.seta.2020.100685
[6] Duffie, J. A. and Beckman, W. A. (2013). Solar engineering of thermal processes. John Wiley & Sons. doi: https://doi. org/10.1002/9781118671603
[7] Kreith, F. (2017). Stirling engines. In Energy Conversion (pp. 447-454). CRC Press.
[8] Zulkifle, I., Alwaeli, A. H., Ruslan, M. H., Ibarahim, Z., Othman, M. Y. H. and Sopian, K. (2018). Numerical investigation of V-groove air-collector performance with changing cover in Bangi, Malaysia. Case studies in thermal engineering, 12, 587-599. doi: https://doi.org/10.1016/j.csite.2018.07.012
[9] Rahmani, E., Moradi, T., Fattahi, A., Delpisheh, M., Karimi, N., Ommi, F. and Saboohi, Z. (2021). Numerical simulation of a solar air heater equipped with wavy and raccoon-shaped fins: The effect of fins’ height. Sustainable Energy Technologies and Assessments, 45, 101227. doi: https://doi.org/10.1016/j.seta.2021.101227
[10] Ammar, M., Mokni, A., Mhiri, H. and Bournot, P. (2021). Performance optimization of flat plate solar collector through the integration of different slats arrangements made of transparent insulation material. Sustainable Energy Technologies and Assessments, 46, 101237. doi: https://doi.org/10.1016/j.seta.2021.101237
[11] López-Sosa, L. B., Ortíz-Carrión, A., Espinosa-Gómez, D., Medina, J. Z. and González-Avilés, M. (2021). Solar air heating system with low environmental impact materials: Mathematical model and optothermal characterization. Sustainable Energy Technologies and Assessments, 47, 101399. doi: https://doi.org/10.1016/j.seta.2021.101399
[12] Zheng, W., Zhang, H., You, S., Fu, Y. and Zheng, X. (2017). Thermal performance analysis of a metal corrugated packing solar air collector in cold regions. Applied energy, 203, 938-947. doi: https://doi.org/10.1016/j.apenergy.2017.06.016
[13] Villar, N. M., López, J. C., Muñoz, F. D., García, E. R. and Andrés, A. C. (2009). Numerical 3-D heat flux simulations on flat plate solar collectors. Solar energy, 83(7), 1086-1092.
[14] Esmalie, F., Ghadamian, H. and Aminy, M. (2014). Modeling and simulation of a solar flat plate collector as an air heater considering energy efficiency. Mechanics & Industry, 15(5), 455-464. doi: https://doi.org/10.1051/meca/2014047
[15] Subiantoro, A. and Ooi, K. T. (2013). Analytical models for the computation and optimization of single and double glazing flat plate solar collectors with normal and small air gap spacing. Applied energy, 104, 392-399. doi: https:// doi.org/10.1016/j.apenergy.2012.11.009
[16] Vall Aubets, S., Johannes, K., David, D. and Castell, A. (2020). A newflat-plate radiative cooling and solar collector numerical model: Evaluation and metamodeling. Energy, 2020, 202, a117750. doi: https://doi.org/10.1016/j. energy.2020.117750
[17] Wang, L., Man, Y., Shi, S. and Wang, Z. (2017). Application of solar air collector and floor air supply heating system in winter. Procedia Engineering, 205, 3623-3629. doi: https://doi.org/10.1016/j.proeng.2017.10.216
[18] Li, W., Xu, S., Dong, H. and You, J. (2011). Numerical Simulation Study on a Flat-Plate Solar Air Collector. In Communication Systems and Information Technology: Selected Papers from the 2011 International Conference on Electric and Electronics (EEIC 2011) in Nanchang, China on June 20-22, 2011, Volume 4 (pp. 117-123). Springer Berlin Heidelberg. doi: https://doi.org/10.1007/978-3-642-21762-3_15
[19] Zoukit, A., El Ferouali, H., Salhi, I., Doubabi, S. and Abdenouri, N. (2019). Simulation, design and experimental performance evaluation of an innovative hybrid solar-gas dryer. Energy, 189, 116279. doi: https://doi.org/10.1016/j. energy.2019.116279
[20] Bhattacharyya, T., Anandalakshmi, R. and Srinivasan, K. (2017). Heat transfer analysis on finned plate air heating solar collector for its application in paddy drying. Energy Procedia, 109, 353-360. doi: https://doi.org/10.1016/j. egypro.2017.03.086
[21] Qiu, L., Zou, Y. and Huang, L. (2011). Simulation Analysis on a Special Air-Heating Collector. Applied Mechanics and Materials, 88, 642-646. doi: https://doi.org/10.4028/www.scientific.net/AMM.88-89.642
[22] Hernandez, A. L. and Quiñonez, J. E. (2013). Analytical models of thermal performance of solar air heaters of double-parallel flow and double-pass counter flow. Renewable Energy, 55, 380-391. doi: https://doi.org/10.1016/j. renene.2012.12.050
[23] Zhang, Y., Selamat, A., Zhang, Y., Alrabaiah, H. and Omar, A. H. (2022). Artificial neural networks/least squares fuzzy system methods to optimize the performance of a flat-plate solar collector according to the empirical data. Sustainable Energy Technologies and Assessments, 52, 102062. doi: https://doi.org/10.1016/j.seta.2022.102062
[24] Hajabdollahi, H., Khosravian, M. and Dehaj, M. S. (2022). Thermo-economic modeling and optimization of a solar network using flat plate collectors. Energy, 244, 123070. doi: https://doi.org/10.1016/j.energy.2021.123070
[25] Abu-Hamdeh, N. H., Khoshaim, A., Alzahrani, M. A. and Hatamleh, R. I. (2022). Study of the flat plate solar collector’s efficiency for sustainable and renewable energy management in a building by a phase change material: Containing paraffin-wax/Graphene and Paraffin-wax/graphene oxide carbon-based fluids. Journal of Building Engineering, 57, 104804. doi: https://doi.org/10.1016/j.jobe.2022.104804
[26] Reichl, C., Kramer, K., Thoma, C., Benovsky, P. and Lemée, T. (2015). Comparison of modelled heat transfer and fluid dynamics of a flat plate solar air heating collector towards experimental data. Solar Energy, 120, 450-463. doi: https:// doi.org/10.1016/j.solener.2015.07.011
[27] Badache, M., Rousse, D., Hallé, S., Quesada, G. and Dutil, Y. (2012). Experimental and two-dimensional numerical simulation of an unglazed transpired solar air collector. Energy Procedia, 30, 19-28. doi: https://doi.org/10.1016/j. egypro.2012.11.004
[28] Mustafa, M. T. and Mustafa, A. T. (2018). Numerical Simulation of Thermal-Hydrodynamic Behavior within Solar Air Collector. Journal of Engineering, 24(3), 29-41. doi: https://doi.org/10.31026/j.eng.2018.03.03
[29] Orszag, S. A. (1993). Renormalisation group modelling and turbulence simulations. Near-wall turbulent flows. https:// www.tib.eu/en/search/id/BLCP%3ACN003216810/Renormalization-group-modeling-and-turbulence-simulations/
[30] Hernández, A. L., Quiñonez, J. E. and López, F. H. (2019). Transient numerical study of thermo-energetic performance of solar air heating collectors with metallic porous matrix. Solar Energy, 178, 181-192. doi: https://doi.org/10.1016/j. solener.2018.12.035
[31] Kareem, M. W., Habib, K., Sopian, K. and Ruslan, M. H. (2017). Multi-pass solar air heating collector system for drying of screw-pine leaf (Pandanus tectorius). Renewable Energy, 112, 413-424. doi: https://doi.org/10.1016/j. renene.2017.04.069
[32] Rekha, L., Vazhappilly, C. V. and Melvinraj, C. R. (2016). Numerical simulation for solar hybrid photovoltaic thermal air collector. Procedia Technology, 24, 513-522. doi: https://doi.org/10.1016/j.protcy.2016.05.088
[33] Orbegoso, E. M., Saavedra, R., Marcelo, D. and La Madrid, R. (2017). Numerical characterisation of one-step and three- step solar air heating collectors used for cocoa bean solar drying. Journal of environmental management, 203, 1080- 1094. doi: https://doi.org/10.1016/j.jenvman.2017.07.015
[34] Salvo, A., Dellicompagni, P., Sarmiento, N., Franco, J. and Echazú, R. (2018). Simulación y validación de un secadero solar directo pasivo mediante simusol. Avances en Energías Renovables y Medio Ambiente, 22, 73-83. https:// portalderevistas.unsa.edu.ar/index.php/averma/article/view/1197
[36] Haghighat, F. (1988). Numerical simulation of the performance of an air heating solar collector. International journal of ambient energy, 9(3), 135-148. doi: https://doi.org/10.1080/01430750.1988.9675926
[37] Bashria, A., Yousef, A., Adam, N. M., Sopian, K., Zaharim, A. and Alghoul, M. (2007). Analysis of single and double passes V-grooves solar collector with and without porous media. Int. J. Energy Environ, 2(1), 109-114. https://www. researchgate.net/publication/241906626_Analysis_of_Single_and_Double_Passes_V-Grooves_Solar_Collector_ With_and_Without_Porous_Media
[38] Bergman, T. L. (2011). Fundamentals of heat and mass transfer. John Wiley & Sons. https://hyominsite.files.wordpress. com/2015/03/fundamentals-of-heat-and-mass-transfer-6th-edition.pdf
[39] Kays, W. M., Crawford, M. E. and Weigand, B. (1980). Convective heat and mass transfer (Vol. 4). New York: McGraw-Hill. https://search.worldcat.org/fr/title/54024127
[40] Iriarte, A., Rodríguez, C., Bistoni, S. and Hall, M. (2014). Simulación de un secadero solar tendalero túnel. caracterización y optimización. Avances en Energías Renovables y Medio Ambiente-AVERMA, 18, 9-18. https://portalderevistas.unsa. edu.ar/index.php/averma/article/view/1997
[41] Press, W. H., Flannery, B. P., Teukolsky, S. A. and Vetterling, W. T. (1992). Runge-kutta method. Numerical recipes in Fortran: The art of scientific computing, 704-716.
[42] Liu, C., Bian, J., Zhang, G., Li, D. and Liu, X. (2018). Influence of optical parameters on thermal and optical performance of multi-layer glazed roof filled with PCM. Applied Thermal Engineering, 134, 615-625. doi: https://doi.org/10.1016/j. applthermaleng.2018.01.117
[43] Liu, C., Wu, Y., Li, D., Ma, T., Hussein, A. K. and Zhou, Y. (2018). Investigation of thermal and optical performance of a phase change material–filled double-glazing unit. Journal of Building Physics, 42(2), 99-119. doi: https://doi. org/10.1177/174425911770873
[44] Ghiami, A. and Ghiami, S. (2018). Comparative study based on energy and exergy analyses of a baffled solar air heater with latent storage collector. Applied Thermal Engineering, 133, 797-808. doi: https://doi.org/10.1016/j. applthermaleng.2017.11.111
[45] Kabeel, A. E., Hamed, M. H., Omara, Z. M. and Kandeal, A. W. (2018). Influence of fin height on the performance of a glazed and bladed entrance single-pass solar air heater. Solar Energy, 162, 410-419. doi: https://doi.org/10.1016/j. solener.2018.01.037
[46] Karim, M. A. and Hawlader, M. N. A. (2006). Performance investigation of flat plate, v-corrugated and finned air collectors. Energy, 31(4), 452-470. doi: https://doi.org/10.1016/j.energy.2005.03.007
[47] A. S. H. R. A. E. (1977). Methods of testing to determine the thermal performance of solar collectors. American Society of Heating, 93-77.
[48] Espinoza, R. and Saravia, L. (2010). Secado solar de productos agroalimentarios en Iberoamérica. Gráfico Editorial.
[49] SEREE. (2021). Sistema de información geográfico: Mapa eólico nacional. Subsecretaría de Energías Renovables y Eficiencia Energética. https://sigeolico.energia.gob.ar/
[50] Kareem, M. W., Habib, K., Sopian, K. and Irshad, K. (2016). Performance evaluation of a novel multi-pass solar air heating collector. Procedia engineering, 148, 638-645. doi: https://doi.org/10.1016/j.proeng.2016.06.528
[51] Zhu, T., Diao, Y., Zhao, Y. and Ma, C. (2017). Performance evaluation of a novel flat-plate solar air collector with micro-heat pipe arrays (MHPA). Applied Thermal Engineering, 118, 1-16. doi: https://doi.org/10.1016/j. applthermaleng.2017.02.076