

Optical aptasensor for in situ detection and quantification of methylxanthines in Ilex guayusa
Aptasensor óptico para la detección y cuantificación in situ de metilxantinas en Ilex guayusa
ACI Avances en Ciencias e Ingenierías
Received: 15 May 2021
Accepted: 14 January 2022
Abstract: the present work pursued the development of a system to detect and quantify methylxanthines in Ilex guayusa. The system, called IPMA (In situ Plant Metabolite Aptasensor), is based on an optical aptasensor that integrates a DNA complex and a porphyrin (NMM IX). IPMA’s ability to detect known amounts of theophylline and caffeine both in solution and infiltrated into guayusa leaves was evaluated. The detection limits determined were: 0.25 mM for theophylline in solution, 0.1 mM for caffeine in solution, and 130 mM for caffeine in I. guayusa leaves. These results demonstrate the potential of IPMA to detect and quantify metabolites of interest directly from biological samples. Developing this type of tool will provide a wide range of applications such as the in situ determination of physiological stress in plants and the characterization of plant varieties with a higher content of compounds of pharmaceutical or food interest.
Keywords: aptasensor, aptamer, methylxanthines, caffeine, theophylline, Ilex guayusa.
Resumen: El presente trabajo buscó el desarrollo de un sistema para detectar y cuantificar metilxantinas en Ilex guayusa. El sistema, denominado IPMA por sus siglas en inglés (Aptasensor de Metabolitos de Plantas In situ), se basa en un aptasensor óptico que integra un complejo de ADN y una porfirina (NMM IX). Se evaluó la capacidad de IPMA para detectar cantidades conocidas de teofilina y cafeína tanto en solución como infiltradas en hojas de guayusa. Los límites de detección determinados fueron: 0.25 mM para teofilina en solución, 0.1 mM para cafeína en solución y 130 mM para cafeína en hojas de I. guayusa. Estos resultados demuestran el potencial de IPMA para detectar y cuantificar metabolitos de interés directamente de muestras biológicas. El desarrollo de este tipo de herramienta ofrece una amplia gama de aplicaciones como la determinación in situ de estrés fisiológico en plantas y la caracterización de variedades vegetales con mayor contenido de compuestos de interés farmacéutico o alimentario.
Palabras clave: aptasensor, aptámero, metilxantinas, cafeína, teofilina, Ilex guayusa.
INTRODUCTION
Detection and quantification of plant metabolites have generally involved the use of sophisticated laboratory facilities as well as complex and time-consuming methods. Conventional techniques include Liquid Chromatography (LC), Mass Spectrometry (MS), Gas Chromatography (GC), or their combination [1-3]. These techniques have shown fair accuracy and effectiveness with some limitations as they need sophisticated equipment and sample preparation steps that can lead to systematic errors [3,4]. In this sense, developing new techniques for rapid and accurate in situ detection and quantification of plant metabolites is essential. Biosensors are an excellent option to meet the needs of accuracy and speed since their advantages in cost, compact size, rapid response, and precision outweigh conventional techniques [5].
Biosensors are analytical devices that integrate a biological sensing component (enzyme, antibody, nucleic acid, and others) with a transducer, which generates a detectable response once an analyte has been detected [6,7]. Among the types of biosensors, optical ones stand for their capacity to induce a change in the absorption, emission, reflection, or refraction of light after the target analyte is recognized [8]. Several advantages come with optical biosensors, including high sensitivity, fast and easy measurements, and minimal invasion for in situ detection [8]. Optical biosensor design may involve aptamers, forming the so-called optical aptasensors [9]. Aptamers are single-stranded nucleic acids capable of binding specific molecules [4,10]. The development of optical aptasensors has been described for many applications that include agriculture, medical diagnostics, food, and environmental measurements [4,9,11,12].
In agriculture, optical aptasensors may assess crop quality and plant physiological state through the measurement of secondary metabolites [13]. These organic compounds play an essential role in plant interaction with the environment since their synthesis is a physiological response against biotic or abiotic stress conditions [14,15]. A significant group of plant secondary metabolites is methylxanthines. This set of compounds includes substances of particular interest such as caffeine and theophylline [16]. Caffeine is the most studied and used methylxanthine worldwide. The major effect of methylxanthines is the stimulation of the central nervous, respiratory, and circulatory systems [17]. At the same time, theophylline is an alkaloid used to treat certain lung conditions characterized by bronchoconstriction such as asthma [18]. The primary role of these substances in some plants has been associated with protection against pathogens and herbivores [19].
Ilex guayusa Loes. (Aquifoliaceae) is a native plant of the Ecuadorian, Peruvian, and Colombian Amazon region whose use as an infusion by local communities has demonstrated its potential over time. Due to its stimulating properties, guayusa has aroused an interest in the food and pharmacological industries [20]. Guayusa is one of the most abundant caffeine sources known, with concentrations that can nearly reach 17 milligrams per gram of dry leaf [21,22]. Although the caffeine content of guayusa has appropriately been described, information about the phytochemical content of this plant is still limited. More knowledge about the phytochemical content in guayusa could be helpful in the optimization of new and straightforward techniques that allow the characterization of guayusa’s cultivars and their possible management and uses.
In this research, we developed an In situ Plant Metabolite Aptasensor (IPMA) that adopts the system reported by Rankin et al. [23] and the recognition strategy of Rivera [24] to quantify caffeine and theophylline directly from guayusa leaves in a fast and easy way. The ingenierías system is integrated by a DNA complex and the N-methyl mesoporphyrin IX dye (NMM IX). The DNA complex consists of a DNA aptamer linked to the C-myc oligonucleotide by seven complementary bases. The NMM IX acts as a signal transducer as it exhibits unique optical properties when interacting with quadruplex DNA structures (GQ) [25]. When caffeine or theophylline is present, the DNA complex disassembles, making the DNA aptamer bind to the methylxanthine. At the same time, the interaction between GQ C-myc and the dye generates fluorescence (Figure 1).
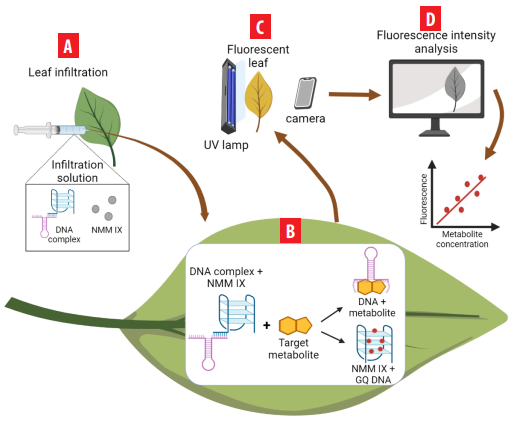
IPMA system scheme. A) DNA complex, NMM IX, and methylxanthine solutions are infiltrated into the leaf. B) 30-minute incubation under darkness is performed. C) Fluorescence is observed through a UV lamp. D) The picture taken is then analyzed through Image J software to measure the fluorescence intensity and determine the methylxanthine concentration (mM). This graphical scheme was created in BioRender.
We evaluated the efficiency of the IPMA system for detecting and quantifying caffeine in Ilex guayusa leaves. Nevertheless, we first validated the system with theophylline and caffeine in solution assays. This research demonstrates the versatility of the IPMA system and presents it as a useful, inexpensive, and reliable metabolite quantification method with the potential to be translated into an agricultural tool.
MATERIALS AND METHODS
DNA complex assembly
The DNA aptamer (5’-GGCGA(dU)ACCAGCCGAAAGGCCC(dU)(dU)GGCAGCG(dU)C-3’) and the C-myc oligonucleotide (5’-TGGGGAGGGTTTTTAGGGTGGGGATATCGCC-3’) (The Midland Certified Reagent Co) were resuspended in TE 1X buffer (5 mM Tris-HCl, 0.5 mM EDTA, pH 7.0) and were quantified in a Nanodrop 2000 (Thermo Scientific). The DNA complex (DNA aptamer - C-myc) assembly was carried out in an Eppendorf microtube with 10 µmoles of DNA aptamer (200 µM), 10 µmoles of oligo C-myc (200 µM), and 100 µL of HEPES buffer (50 mM HEPES, 40 mM KCl, 400 mM NaCl, 0.1% (w/v) Triton X-100, 2% (v/v) DMSO, pH 7.0). The oligonucleotide suspensions were heated using a thermocycler (TPersonal, Biometra) with an initial temperature of 95°C for 5 minutes; then, two cycles of 80°C (1 minute), 60°C (1 minute), 40°C (1 minute), 30°C (5 minutes); and a final cooling at 4°C for 10 minutes. The assembled complex was stored at -20°C.
DNA complex assembly verification
The DNA complex assembly test was based on the NMM IX (Frontier Scientific) absorption spectra analysis. For this, 2 µL of the DNA complex, previously assembled, was placed on a spectrophotometer microplate (Multiscan Sky, Thermo Fischer), and the UV-visible spectrum was collected.
Theophylline and caffeine stocks preparation and quantification
The caffeine stock solution was prepared by dissolving 5 mg of anhydrous caffeine powder (Refaquim) in 1 mL of ultra-pure water. The solution was homogenized on a shaker at room temperature and then stored at 4°C. The theophylline stock solution was prepared by grinding up 250 mg of theophylline tablets (Genfar) into a fine powder. Then, 100 mL of phosphate buffer (66.72 mM KH2PO4, 80.87 mM Na2HPO4, pH 7.4) was added. The solution was incubated at 37°C under constant stirring for 24 hours and then stored at 4°C. The solutions were quantified by spectrophotometry (Multiscan Sky, Thermo Fischer) using the Lambert Beer-Bouguer law. For theophylline, the molar extinction coefficient was 10200 cm-1 M-1 at 277 nm [27], and for caffeine, 9900 cm-1 M-1 at 272 nm [26].
Plant material
Guayusa leaves were obtained from plants maintained at the greenhouse of the Plant Biotechnology Laboratory (USFQ). We collected equal-sized leaves from the same branch of the plant.
IPMA system validation and optimization
A solution test was performed to validate the effectiveness of the IPMA system to detect methylxanthines. For this purpose, two solutions were prepared: a) 25 µL solution containing the DNA complex (50 µM), NMM IX (50 µM), and theophylline (7 mM) and b) 25 µL solution with the DNA complex (50 µM), NMM IX (50 µM), and PCR-grade water.
For the IPMA system optimization, several factors were considered, including the DNA complex – NMM IX concentration, the operating temperature, and the fluorescence analysis.
DNA complex - NMM IX concentration
Several solution tests were carried out to determine the optimal DNA complex – NMM IX concentration. Five ratios were evaluated (2:1, 4:1, 10:1, 20:1, and 40:1). 20 µL solutions containing the DNA complex (4 μM), NMM IX (2 μM, 1 μM, 0.4 μM, 0.2 μM, 0.1 μM), and theophylline (7000 μM) were prepared. In parallel, 20 µL solutions containing the DNA complex (4 µM), NMM IX (2 μM, 1 μM, 0.4 μM, 0.2 μM, 0.1 μM), and PCR-grade water were elaborated. Each solution was prepared in duplicate and incubated under darkness and at room temperature for 25 minutes approximately.
The selection criteria for the optimal DNA complex – NMM IX concentration were: i) the solution containing the DNA complex – NMM IX and the methylxanthine should exhibit high fluorescence signal easily identifiable to the naked eye, and ii) the solution containing the DNA-NMM IX complex in the absence of methylxanthine should have a low fluorescence signal.
Temperature
To identify the aptasensor optimal operating temperature, the absorption spectra of the DNA complex – NMM IX at different temperatures were analyzed. 500 µL of a solution containing 20 µM of the assembled DNA complex and 2 µM of NMM IX was prepared. 2 µL of the solution were placed on the spectrophotometer microplate reader (Multiscan Sky, Thermo Fischer), and the temperature was increased from 21°C to 43°C. The UV- visible spectra were collected each time the temperature increased by one-degree centigrade.
Fluorescence analysis
To identify the best way to capture the fluorescent signal, two different lighting systems were used. The first was the Bio-Imaging lamp (HK-01-DNR) that emits light with a wavelength between 380 and 420 nm. The second lighting system was a blue LED box (Maviju IL070206) which is a wooden box with a blue LED light bulb inside that emits light with a wavelength between 440 and 460 nm.
In both cases, photographs of the leaves exposed to the lighting systems were taken with a mobile camera (Samsung S20+). The angle of capture and the distance from the camera to the sample were controlled and kept constant in all shots (Figure 2C). All the photos were analyzed with Image J 1.52v. The intensity of the fluorescent solutions was calculated by measuring the integrated density of the image previously split in RGB channels. The measurements were done in Eppendorf tubes for the solution tests and in areas that visibly fluoresced on the guayusa leaves. In the Image J software 1.52v, only the red channel was used for the corresponding analysis.
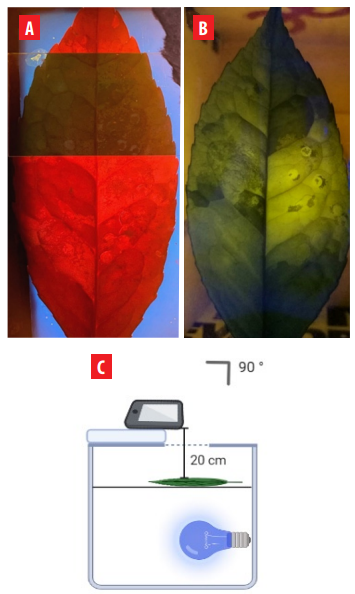
Two lighting systems for fluorescence signal. A) Bio-Imaging lamp (380 to 420 nm). B) Blue LED (440 to 460 nm). C) Lighting systems capturing images scheme.
IPMA validation for quantification of theophylline and caffeine in solution
The assembled DNA complex and the NMM IX were placed in four Eppendorf (1.5 mL) tubes in a 10:1 proportion (5 µM and 0.5 µM, respectively). Next, a known concentration of theophylline (7 mM, 1.5 mM, 0.4 mM, and 0 mM) or caffeine (6 mM, 3 mM, 0.2 mM, and 0 mM) was added in each tube. Ultra-pure water was added in a fifth tube instead of the methylxanthines as a blank. The solutions were homogenized and incubated in the dark and at room temperature for 60 minutes approximately.
IPMA validation for quantification of caffeine in guayusa leaves
I. guayusa young leaves were immersed in Agrex-F 0.1% (Tekquimik) solution for 60 minutes. Then, known concentrations of caffeine (0 mM, 150 mM, and 300 mM) solutions were syringe-infiltrated into specific areas of the leaves. The assembled DNA complex (5 µM) and the NMM IX (0.5 µM) were infiltrated near the spot where the caffeine solution was injected. The leaves were immediately incubated in the dark and at room temperature for 20 minutes. All assays were run in duplicate.
RESULTS
DNA complex assembly verification
The DNA complex assembly test was based on the dye (NMM IX) absorption spectra analysis. The absorption spectrum of the NMM IX incubated with the assembled DNA complex showed maximum absorption at 378 nm. On the other hand, the maximum absorption of the dye incubated with the unassembled DNA complex occurred at 399 nm (Figure 3). These results demonstrate that the assembled DNA complex does not induce any change in NMM IX’s optical properties, indicating that the assembly process was successful.
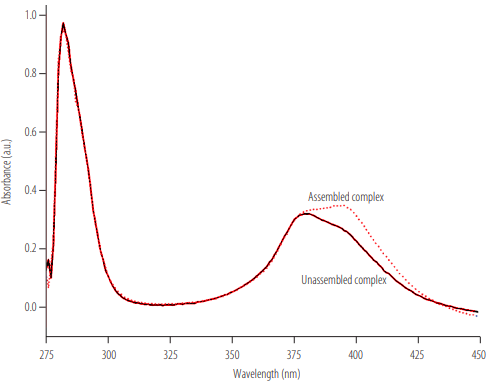
Absorption spectrum of NMM IX incubated with the assembled DNA complex; a maximum absorption of NMM IX at 399 nm is observed when the DNA complex is properly assembled.
IPMA System validation and optimization
In the validation test, an almost 20-fold fluorescence increase was identified in the presence of 7 mM theophylline, which could be observed at first glance (Figure 4). This fluorescence increase is due to the presence of theophylline in the solution, which demonstrates IPMA’s ability to detect a methylxanthine.
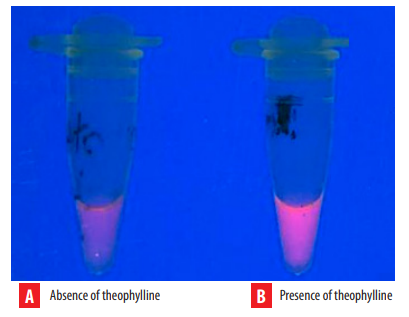
IPMA validation in solution. A) DNA complex and NMM IX solution. B) DNA complex and NMM IX incubated with theophylline (7 mM). A 20-fold increase in fluorescence was measured in the theophylline-containing solution.
Regarding IPMA’s optimization, the results are described below:
DNA complex and NMM IX concentration
Three of the five DNA complex - NMM IX ratios tested (10:1,20:1, and 40:1) met the two criteria (see Methods) for the proper functioning of the aptasensor. None of the ratios showed significant differences regarding their fluorescence intensity (p > 0.05 for the one-way ANOVA). However, since the lowest concentration of reagents is desirable, the 10:1 ratio was selected for IPMA as the optimal DNA complex - NMM IX (Figure 5).
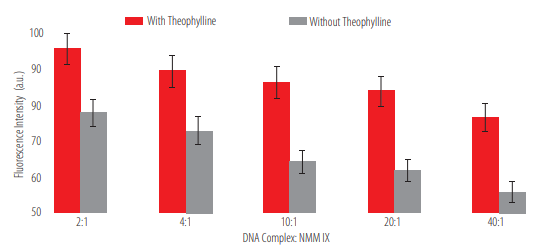
DNA complex - NMM IX concentration optimization. The fluorescence intensity on a theophylline- containing solution and on a theophylline-non-containing solution was analyzed in five different ratios. There were no significant differences (p >0.05 for the one-way ANOVA).
Temperature
To determine the temperature at which the DNA complex assembly is no longer stable, we analyzed the DNA complex - NMM IX absorption spectra at different temperatures. A gradual movement of the NMM IX’s maximum absorption peak towards 399 nm was observed when the temperature was around 29 - 33°C (Figure 6). The maximum absorbance at 399 nm indicates that the complex has disassembled. In this case, the disassembly occurs due to the temperature only (since there is no methylxanthine present in the solution). This means that the biosensor works properly at temperatures lower than 29°C; above this temperature, non-specificities could be observed.
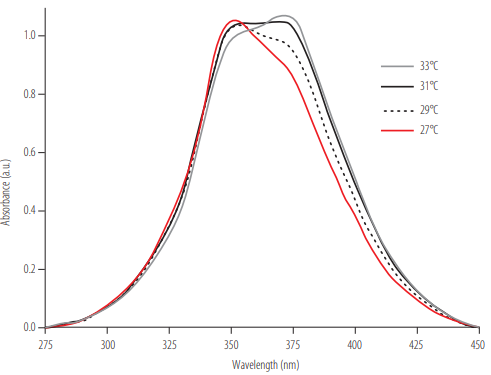
Absorption spectra of NMM IX incubated with the assembled DNA complex. The spectra collected at different temperatures are shown. A gradual movement of 21 nm of the maximum absorption peak is observed.
Fluorescence analysis system
The Bio-Imaging lamp was the best lighting system to capture fluorescence from the solution tests. Nevertheless, when guayusa leaves were illuminated with the BioImaging lamp, it was impossible to identify fluorescence attributable to NMM IX, as the entire leaf surface fluoresced (Figure 2A). However, when the guayusa leaves were illuminated with the blue LED box, NMM IX’s fluorescence was easily detectable (Figure 2B). The best fluorescent signal using this lamp was observed when the sample was placed at an angle of 90° and 20 cm from the detector.
IPMA for quantification of theophylline and caffeine in solution
The fluorescent signal in the solution tests showed a direct proportional relationship to the methylxanthine concentration (theophylline or caffeine) (Figures 7 and 8). The trend line generated with fluorescence shows the same trend as that obtained with UV- vis spectrophotometry. A high correlation was determined when this fluorescence was analyzed through Image J (R2 = 0.90 for theophylline; R2 = 0.986 for caffeine). The limits of detection (LOD) were calculated following the equation:
where δ is one standard deviation [28].
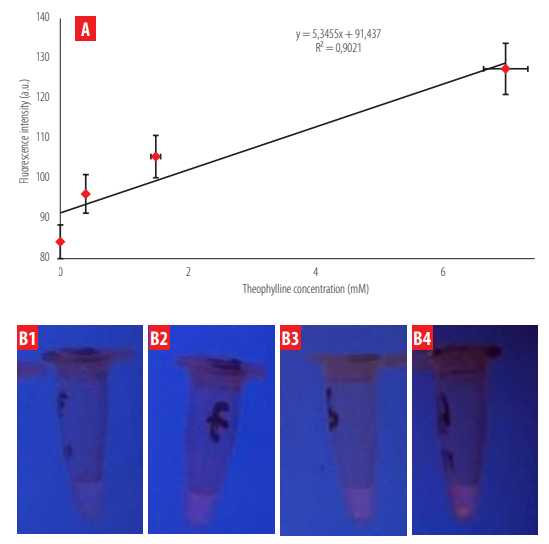
Fluorescence intensity as a function of theophylline content in solution. A) The fluorescence intensity detected through Image J is shown for four theophylline concentrations incubated with IPMA. B) Fluorescence visualization of the four theophylline concentrations (B1 = 0 mM; B2 = 0.4 mM; B3 = 1.5 mM; B4 = 7 mM) under the Bio-Imaging lamp and Multiscan Sky, respectively.
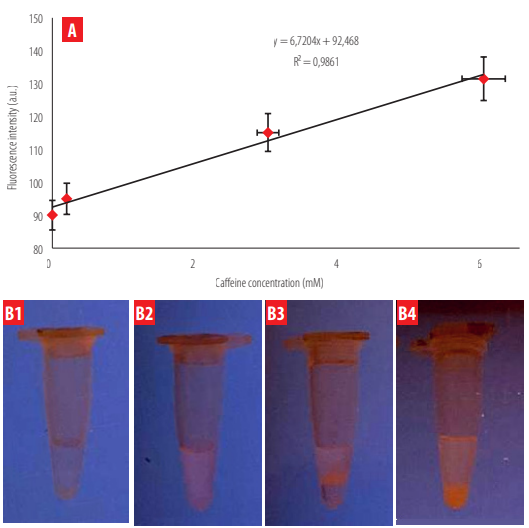
Fluorescence intensity as a function of caffeine content in solution. The fluorescence intensity detected through Image J is shown for four caffeine concentrations incubated with IPMA. B) Fluorescence visualization of the four caffeine concentrations (B1 = 0 mM; B2 = 0.2 mM; B3 = 3 mM; B4 = 6 mM) using the Bio-Imaging lamp and Multiscan Sky, respectively.
The obtained LOD values were 0.1 mM for caffeine and 0.25 mM for theophylline, respectively. Fluorescence intensity changes due to methylxanthine concentration were more evident for caffeine than for theophylline.
IPMA for quantification of known concentrations of caffeine in Ilex guayusa leaves
In I. guayusa leaves, the fluorescent signal showed a proportional behavior with respect to the syringe-infiltrated caffeine concentration (Figure 9A). A high correlation was also determined when this fluorescence was analyzed through Image J (R2= 0.99). A limit of detection (LOD) of 130 mM was calculated.
As shown in Figure 9B, the fluorescence increment is detectable to the naked eye, but it is less evident compared to the solution treatments.
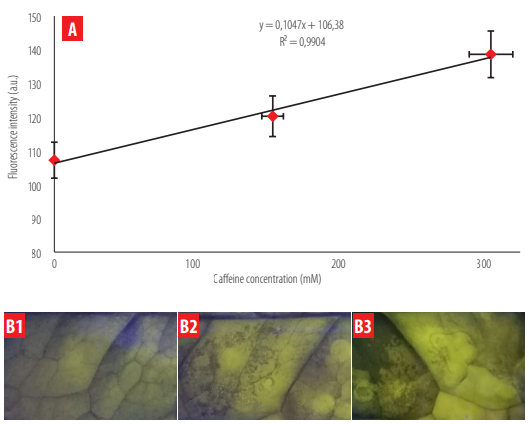
Fluorescence intensity as a function of caffeine content in guayusa leaves. A) Fluorescence intensity detected through Image J is shown for three different caffeine concentrations infiltrated into guayusa leaves. B) Fluorescence visualization of the three caffeine concentrations (B1 = 0 mM; B2 = 150 mM; B3 = 300 mM) using a Blue LED box.
DISCUSSION
IPMA quantification strategy
In this study, we present an efficient, fast, and cost-effective tool for plant metabolites quantification. We propose a specific mechanism of function of the IPMA systems based on the disassembly of the DNA complex when a methylxanthine is present. As the hydrogen bonds break, the DNA aptamer separates from the C-myc oligo and changes its structure to bind the methylxanthine. The C-myc oligo adopts its natural G-quadruplex (GQ) structure and is free to interact with the dye (NMM IX). It has been reported that the binding of NMM IX and GQ-DNA allows NMM IX to fluoresce with great intensity [29,30] (Figure 1).
Aptasensors using NMM IX and a GQ-DNA structure have been widely reported for environmental monitoring [30,31]. The unique NMM IX chemical properties have made it useful in medical sciences for the localization of non-canonical DNA structures, such as those involved in genomic stability and cancer [32]. Other applications of these kinds of biosensors include detecting simple and complex molecules such as proteins [33], toxins [34], or pesticides [35]. Precisely, one of the most remarkable examples in terms of agricultural applications is an NMM-GQ sensor to detect organophosphates in agricultural products [36]. However, to the best of our knowledge, no biosensor prototype based on GQ-DNA and NMM IX has been reported for in situ plant metabolite detection and quantification. In this sense, our IPMA system constitutes an innovative alternative to detect a target molecule directly from plant leaves quickly and efficiently.
IPMA System Optimization
Once it was verified that the IPMA strategy worked and allowed the detection of methylxanthines, it was necessary to optimize some factors to achieve a good enough fluorescence signal to quantify the target molecule accurately.
The first optimized factor was the concentration of the DNA complex and the dye (NMM IX). Three ratios were observed to work well. However, since the 10:1 ratio uses the lowest reagent concentration, it was selected for the IPMA subsequent tests. The use of a molar excess of 10 DNA molecules for each NMM molecule has been previously reported as a good ratio to obtain enhanced fluorescence signals [31]. Evaluating the DNA complex - NMM IX concentration is a crucial factor to avoid erroneous quantifications since an excess or lack of DNA could affect the interpretation of the fluorescence signal [37].
Another optimized factor was the temperature. DNA complex kept assembled in the absence of the target and disassembled in its presence. Therefore, the aptamer recognition of its caffeine or theophylline target depends on breaking the hydrogen bonds that join DNA molecules. It is known that the hydrogen bonds that generate the complementarity of bases can be broken easily as a function of temperature [38,39]. For instance, it is necessary to establish the temperature at which the DNA complex assembly remains stable. The absorption spectrum of NMM IX was studied to identify the optimal assembly temperature ofthe DNA complex. NMM IX has two unique optical properties in the presence of a GQ structure like C-myc. First, it presents a 60-fold increase in fluorescence compared to its basal state when the emission spectrum is analyzed. Second, it exhibits a 21 nm red shift in the absorption spectrum. This means that when NMM IX is in solution, it has a maximum light absorption at 378 nm, but in the presence of a GQ structure, the maximum absorption is at 399 nm [33, 40]. To verify that the DNA complex assembly was no longer stable, it was necessary to identify the temperature at which the 21 nm red shift phenomena occurred. As can be seen in Figure 5, the red shift occurred gradually between 29°C and 33°C. This proves that the complex assembles well below 29°C. At higher temperatures, the fluorescence observed might be increased by the spontaneous disassembly of the DNA complex.
A third optimized factor was fluorescence visualization. For the solution tests, fluorescence differences with theophylline were less noticeable to the naked eye than with caffeine when analyzed with Image J. Such observations were made considering that the perception of color depends on several factors, mainly light source, detection mode, and the detector [41]. In humans, color perception is difficult to control since it depends on the interaction of signals generated by photoreceptors sensitive to the visible electromagnetic spectrum [42]. For leaf assays, when the guayusa leaves were placed on different light sources, there were differences in the fluorescence visualization (Figure 6). A variety of fluorescent molecules can be found in biological samples [21]. One of the main components of plants is chlorophylls, which can absorb and emit light at different wavelengths [44]. It has been reported that plants of the Ilex genus have chlorophyll A and B, but there is no information about their content in I. guayusa leaves [45]. The maximum absorption for chlorophyll A occurs at 372 nm, and for chlorophyll B at 392 nm [44,45]. On these premises, it can be assumed that the observed fluorescence when the leaf was exposed to a Bio-imaging lamp is in part due to the emission of chlorophyll and not to IPMA.
IPMA for the quantification of theophylline and caffeine
It was determined that as the methylxanthine (theophylline or caffeine) concentration increases, the emitted fluorescent signal increases as well. This is a particular fact of systems based on GQ - NMM IX complexes, in which the fluorescence emitted is directly proportional to the analyte concentration [25].
When evaluating the performance of an aptasensor, it is essential to analyze the detection limit (LOD). The LOD corresponds to the minimum concentration of a substance whose detection signal is significantly different from the blank (background) [46]. For theophylline in solution, the LOD was 0.25 mM, a value that, although in the range previously described for aptamer-based biosensors (50 nM – 600 μM) [47], is much higher than the values reported in Rankin et al. [23] for RNA aptamers. In the case of caffeine in solution, the LOD was 90.01 μM, a lower value than that reported for theophylline but which is still higher than the LOD described by McKeague & DeRosa [48] for xanthines (<10 μM).
In the guayusa leaves, the calculated LOD was 130 mM of caffeine. This LOD does not correspond to the natural caffeine content in the leaf but to the injected caffeine solution. This is a limitation of the IPMA system that should be overcome through a standardization. To achieve this, it will be necessary to validate the IPMA measurements using another quantification method. Methods for quantifying methylxanthine in leaves often require more sophisticated equipment or extractions that involve manipulations with solvents that are not readily available [49]. However, the results obtained with the caffeine solution injected into the leaf are proof of the concept that IPMA is efficient for quantifying caffeine in a matrix such as the guayusa leaf.
Although the diversity of optical biosensors for detecting compounds of interest in plants is quite large, an aptasensor like this one has not been developed before. The most similar development has been nanosensors for detecting metabolites in animal and fungal cells, both in vivo and in vitro conditions [50].
Theophylline and caffeine are metabolites of great interest for which several types of sensors have been proposed, either electrochemical [51] or through fluorescent probes using chemical compounds [52]. Since 2007 there have been reports of amperometric biosensors with the capacity to detect from 0.1 to 1mg/mL of caffeine in solution, but with a complex structure that restricts the possibility of performing in situ quantifications [53]. Although IPMA’s LOD does not reach the level of sensitivity offered by other alternatives, a feature that can be optimized, it requires only a DNA complex - NMM IX and a blue light lamp, which can be easily adapted as a portable tool for detection of the methylxanthine content in guayusa and other plants.
Towards an agricultural analysis tool
Part of the agriculture transition involves the adoption of new, easy-to-use, and affordable innovations [54]. Several optical aptasensors have been described as a potential tool for food safety and food fraud indicators, as well as sustainable agriculture supporters [55,56]. In fact, detecting and quantifying a secondary metabolite could help farmers to make corrective actions or infer the quality of a crop. As an example, it is known that theobromine is a secondary metabolite of Theobroma cacao that is associated with the cacao’s quality due to the bitterness that this substance might give to the chocolate [57,58]. In this sense, a system such as IPMA could allow the selection of T. cacao cultivars according to the amount of theobromine present.
Further applications of aptasensors could be selecting cultivars with higher contents of methylxanthines or even other types of molecules. Such selection could facilitate the production of more naturally stimulating products, especially for the hot tea beverage industry. Also, physiological studies applied to crops could allow growers to infer possible stress mitigation strategies at the irrigation, nutrition, or even pathogen control approaches. For example, naringenin is a metabolite produced by citrus trees in response to attacks by certain insects [59]. If the amount of naringenin is quantified in the plant tissues, the magnitude of a pest could be assessed and appropriate corrective treatments (insecticide) could be applied [60]. In guayusa, very little is known about the physiological function of caffeine; therefore, detecting and quantifying this substance from its leaves under different environmental stimuli could contribute to learning more about the importance of this compound for the physiology and adaptation of this fascinating Amazonian plant.
CONCLUSION
IPMA constitutes a compelling attempt to detect and quantify plant metabolites, which would support agricultural practices. Moreover, the simplicity, portability, and adaptability of the IPMA technology make it suitable as an in situ application. The cost advantage is another aspect that must be considered as IPMA does not need sophisticated facilities for the analysis. The results obtained in this study suggest that the IPMA strategy corresponds to a turn-on, enzyme-free, GQ - NMM IX optical biosensor with a great potential to detect and quantify plant metabolites both in solution and in plant tissues. Our system could detect theophylline (0.25 mM as LOD) and caffeine (0.1 mM as LOD in solution and 130 mM as LOD in the guayusa leaf).
Even though the IPMA system is specific to caffeine and theophylline, optical biosensors based on DNA aptamers are versatile and can be applied to detect and quantify several molecules of interest. In I. guayusa, the in situ quantification of caffeine content could be interesting for evaluating the metabolite content of different cultivars.
ACKNOWLEDGEMENTS
The authors would like to thank the USFQ Laboratory of Plant Biotechnology for their support in the development of this research. The authors are very grateful to Miguel Ángel Mendez, who provided us with some of the initial reagents for the project’s development.
FUNDING
This project was carried out with funds provided by Universidad San Francisco de Quito USFQ’s internal funding program “COCIBA Grants 2019.”
AUTHORS' CONTRIBUTIONS
B.L., A.M., D.M. and D.C. performed the experiments, and wrote the manuscript. B.L. and A.M. developed the methodology. M.L.T supervised the research and the manuscript.
CONFLICTS OF INTEREST
The authors have no conflicts of interest to declare.
References
[1] Fiehn, O. (2016). Metabolomics by Gas Chromatography-Mass Spectrometry: Combined Targeted and Untargeted Profiling. Current Protocols on Molecular Biology, 114, 30.4.1-30.4.32. doi: http://doi.org/10.1002/0471142727.mb3004s114
[2] Jorge, T. F., Mata, A., & António, C. (2016). Mass Spectrometry as a Quantitative Tool in Plant Metabolomics. Phil. Trans. R. Soc. A, 374. doi: http://dx.doi.org/10.1098/rsta.2015.0370
[3] Lu, W., Su, X., Matthias, S., Klein, I., Lewis, A., Fiehn, O., & Rabinowitz, J. D. (2017). Metabolite Measurement: Pitfalls to Avoid and Practices to Follow. Annual Review of Biochemistry, 86, 277-304. doi: http://doi.org10.1146/annurev-biochem-061516-044952
[4] Liu, M., Khan, A., Wang, Z., Liu, Y., Yang, G., Deng, Y. & He, N. (2019). Aptasensors for Pesticide Detection. Biosensors and Bioelectronics, 130, 174-184. doi: http://doi.org/10.1016/j.bios.2019.01.006
[5] Serna-Cock, L., & Perenguez-Verdugo, J. G. (2011). Biosensors Applications in Agri-Food Industry. Environmental Biosensors (May). doi: http://doi.org/10.5772/16744
[6] Gouvea, C. (2011). Biosensors for Health Applications. Biosensors for Health, Environment and Biosecurity, 71-85. doi: http://doi.org/10.5772/17103
[7] Romero, M. (2012). Estudio Químico y Electroquímico de Interacciones Entre Biomoléculas y Sus Aplicaciones En Biosensores. (Doctoral Thesis). Universidad Nacional de Córdoba, Argentina.
[8] Malhotra, B. D., & Ali, M. A. (2018). Nanomaterials in Biosensors: Fundamentals and Applications. In Nanomaterials for Biosensors.Elsevier. doi: https://doi.org/10.1016/C2015-0-04697-4
[9] Feng, C., Dai, S., & Lei, W. (2014). Optical Aptasensors for Quantitative Detection of Small Biomolecules: A Review. Biosensors and Bioelectronics, 59, 64-74. doi: http://doi.org/10.1016/j.bios.2014.03.014
[10] Hernández, J., & Botero Hincapié, J. A. (2012). Aptámeros: Agentes Diagnósticos y Terapéuticos. Iatreia, 25(2), 159168. ISSN 0121-0793. https://www.redalyc.org/articulo.oa?id=180523365008
[11] Hong, P., Li, W., & Li, J. (2012). Applications of Aptasensors in Clinical Diagnostics. Sensors. Sensors (Basel), 12(2), 1181-1193. doi: https://doi.org/10.3390/s120201181
[12] Sett, A., Das, S., Sharma, P., & Bora, U. (2012). Aptasensors in Health, Environment and Food Safety Monitoring. Open Journal of Applied Biosensor, 1(2). doi: https://doi.org/10.4236/ojab.2012.12002
[13] Rana, J. S., Jindal, J., Beniwal, V., & Chhokar, V. (2010). Utility Biosensors for Applications in Agriculture - A Review. Journal of American Science, 6(9), 353-375. https://citeseerx.ist.psu.edu/viewdoc/download?doi=10.1.1.469.8344&rep=rep1&type=pdf
[14] Kumar Sharma, R., & Kumar, I. (2018). Production of Secondary Metabolites in Plants under Abiotic Stress: An Overview. Significances of Bioengineering & Biosciences, 2(4). doi: https://doi.org/10.31031/sbb.2018.02.000545
[15] Pagare, S., Manila, B., Tripathi, N., & Bansal, Y. K. (2015). Secondary Metabolites of Plants and Their Role: Overview. Current Trends in Biotechnology and Pharmacy, 9(3), 293-304. ISSN 2230-7303 (Online).
[16] Andreeva, E. Y., Dmitrienko, S. G., Zolotov, Y. A. (2012) Methylxanthines: properties and determination in various objects Russian Chemical Reviews, 81(5), 397-414. doi: http://dx.doi.org/10.1070/RC2012v081n05ABEH004220
[17] Evans, J., Richards, J. R., & Battisti, A. S. (2021) Caffeine. In: StatPearls. StatPearls Publishing.
[18] Bucklin, M. H., & Groth, C. M. (2014). Theophylline. In Encyclopedia of Toxicology (Third Edition). Elsevier. ISBN: 9780-12-386455-0
[19] Ashihara, H., Kato, M., & Crozier, A. (2011). Distribution, biosynthesis and catabolism of methylxanthines in plants. Handb. Exp. Pharmacol., 200, 11-31. doi: http://doi.org/10.1007/978-3-642-13443-2_2
[20] Kapp, R., Mendes, O., Roy, S., & McQuate, R. (2016). General and Genetic Toxicology of Guayusa Concentrate (Ilex guayusa). International Journal of Toxicology, 35(2), 222-242. doi: https://doi.org/10.1177/1091581815625594
[21] Ratsch, C. (2005). The encyclopedia ofpsychoactive plants: Ethnopharmacology and its applications. Simon and Schuster.
[22] Melo, V. (2014). Composición y análisis fitoquímico de la especie Ilex guayusa Loes. (Thesis). Universidad San Francisco de Quito, Ecuador.
[23] Rankin, C. J., Fuller, E. N., Hamor, K. H., Gabarra, S. A., & Shields, T. P. (2006). A Simple Fluorescent Biosensor for Theophylline Based on Its RNA Aptamer. Nucleosides, Nucleotides and Nucleic Acids, 25(2), 1407-1424. doi: http://doi.org/10.1080/15257770600919084
[24] Rivera, P. (2016). Diseño de un sistema de reporte, específico, in vitro de un metabolito de interés agroindustrial, teofilina, vía ensayos con aptámeros y fluorescencia (Thesis). Universidad San Francisco de Quito USFQ.
[25] Yett, A., Yingqi, L., Beseiso, D., Miao, J., & Yatsunyk., L. A. (2019). N-Methyl Mesoporphyrin IX as a Highly Selective Light-up Probe for G-Quadruplex DNA. Journal of Porphyrins and Phthalocyanines, 23(11n12), 1195-1215. doi: https://doi.org/0.1142/S1088424619300179
[26] Schack, J. A., & Waxler, S. H. (1949). An Ultraviolet Spectrophotometric Method for the Determination of Theophylline and Theobromine in Blood and Tissues. The Journal of Pharmacology and Experimental Therapeutics, 97(3), 283-91. https://pubmed.ncbi.nlm.nih.gov/15392550/
[27] Londoño-Larrea, P., Zapata, S., Lara-Lopez, M., & Villamarin-Barriga, E. (2018). Preliminary study of caffeine extraction from Ilex guayusa L. leaves using supercritical carbon dioxide. Conference: MOL2NET 2018, International Conference on Multidisciplinary Sciences (4th edition). doi: https://doi.org/10.3390/mol2net-04-05297
[28] Miller, J. N., & Miller, J. C. (2010). Statistics for analytical chemistry: 6th ed. Pearson Education Limited.
[29] Schack, J. A., & Waxler, S. H. (1949). An Ultraviolet Spectrophotometric Method for the Determination of Theophylline and Theobromine in Blood and Tissues. The Journal of Pharmacology and Experimental Therapeutics, 97(3), 283-91. https://pubmed.ncbi.nlm.nih.gov/15392550/
[30] Umar, M. I., Ji, D., Chan, C. Y., & Kwok, C. K. (2019). G-Quadruplex-Based Fluorescent Turn-On Ligands and Aptamers: From Development to Applications. Molecules, 24(13), 2416. doi: https://doi.org/10.3390/molecules24132416
[31] Zhao, C., Wu, L., Ren, J., & Qu, X. (2011). A Label-Free Fluorescent Turn-on Enzymatic Amplification Assay for DNA Detection Using Ligand-Responsive G-Quadruplex Formation. Chemical Communications, 47(19), 5461-63. doi: https://doi.org/10.1039/c1cc11396h
[32] Sabharwall, N., Savikhin, V., Turek-Herman, J., Nicoludis1, J., Szalai, V., & Yatsunyk, L. (2014). N-methylmesoporphyrin IX fluorescence as a reporter of strand orientation in guanine quadruplexes. FEBS Journal, 281(7), 1726-1737. doi: https://doi.org/10.1111/febs.12734
[33] Hansel-Hertsch, R., Di Antonio, M., & Balasubramanian, S. (2017). DNA G-quadruplexes in the human genome: detection, functions and therapeutic potential. Nat Rev Mol Cell Biol, 18(5), 279-284. doi: https://doi.org/10.1038/nrm.2017.3
[34] Zhao, D., Dong, X., Jiang, N., Zhang, D., & Liu, C. (2014). Selective recognition of parallel and anti-parallel thrombinbinding aptamer G-quadruplexes by different fluorescent dyes. Nucleic Acids Research, 42(18), 11612-11621. doi: https://doi.org/10.1093/nar/gku833
[35] Wang, J., Wang, Y., Liu, S., Wang, H., Zhang, X., Song, X., Yu, J., & Huang, J. (2019) Primer remodeling amplification- activated multisite-catalytic hairpin assembly enabling the concurrent formation of Y-shaped DNA nanotorches for the fluorescence assay of ochratoxin A. Analyst, 144(10), 3389-3397. doi: https://doi.org/10.1039/C9AN00316A
[36] Yuan, X., Chen, S., Li, S., Liu, Q., Kou, M., Xu, T., Luo, H., Huang, K., & Zhang, M. (2019). Enzymatic Reaction Modulation of G-Quadruplex Formation for the Sensitive Homogeneous Fluorescence Sensing of Cholinesterase and Organophosphate Pesticides. Analytical Methods, 11(7), 980-88. doi: https://doi.org/10.1039/c8ay01996g
[37] Yao, Y., Liu, Y., Zhang, H., & Wang, X. (2019). A highly sensitive and low-background fluorescence assay for pesticides residues based on hybridization chain reaction amplification assisted by magnetic separation. Methods and Applications in Fluorescence, 7(3). https://iopscience.iop.org/article/10.1088/2050-6120/ab1e7a/meta
[38] Kachalkin, A. K., Rumshtein, V., Minkova, A. P., Petrukhin, V. I., Suvorov, V. M., Horvath, D., &. Yutlandov, I. A. (1979). Temperature breaking of hydrogen bonds in water on negative-pion capture by hydrogen. Zh. Eksp. Teor. Fiz. 77, 2630. http://jetp.ras.ru/cgi-bin/dn/e_050_01_0012.pdf
[39] Ohtaki, H. (2003). Effects of Temperature and Pressure on Hydrogen Bonds in Water and in Formamide. Journal of Molecular Liquids, 103, 3-13. doi: https://doi.org/10.1016/S0167-7322(02)00124-1
[40] Avagliano, D., Tkaczyk, S., Sánchez-Murcia, P. A., & González, L. (2020). Enhanced Rigidity Changes Ultraviolet Absorption: Effect of a Merocyanine Binder on G-Quadruplex Photophysics. The Journal of Physical Chemistry Letters, 11(23), 10212-10218. doi: https://doi.org/10.1021/acs.jpclett.0c03070
[41] Banerjee, S., Kumar Verma, P., Kumar Mitra, R., Basu, G., & Kumar Pal, S. (2012). Probing the Interior of SelfAssembled Caffeine Dimer at Various Temperatures. Journal of Fluorescence Mar, 22(2), 753-69. doi: https://doi.org/10.1007/s10895-011-1011-3
[42] Hofmann, L., & Palczewski, K. (2015). Advances in understanding the molecular basis of the first steps in color vision. Progress in retinal and eye research, 49, 46-66. doi: https://doi.org/10.1016/j.preteyeres.2015.07.004
[43] Dresp, B. (2016). Colour perception across the species. HAL. https://hal.archives-ouvertes.fr/hal-01249428/document
[44] Milne, B, Toker, Y., Rubio, A. & Br0ndsted, S. N. (2015). Unraveling the Intrinsic Color of Chlorophyll. Angewandte Chemie. International Edition 54(7), 2170-2173. doi: https://doi.org/10.1002/anie.201410899
[45] Prahl, S. (2017). Chlorophyll a. OMCL. https://omlc.org/spectra/PhotochemCAD/htm/122.html
[46] Radice, M., & Vidari, G. (2007). Caracterización fitoquímica de la especie Ilex guayusa Loes y elaboración de un prototipo de fitofármaco de interés comercial. La Granja, 6(2), 3. doi: https://doi.org/10.17163/lgr.n6.2007.01
[47] Rebolo López, S. (2007). Estudio de la composición polifenólica de vinos tintos gallegos con D.O.: Ribeiro, Valdeorras y Ribeira Sacra (Thesis). Universidad Santiago de Compostela, Lugo. https://minerva.usc.es/xmlui/bitstream/ handle/10347/2353/9788497509435_content.pdf;sequence=1
[48] Chepkoech Kilele, J., Chokkareddy, R., Rono, N., & Redhi, G. G. (2020). A novel electrochemical sensor for selective determination of theophylline in pharmaceutical formulations. Journal of the Taiwan Institute of Chemical Engineers, 111, 228-238. doi: https://doi.org/10.1016/j.jtice.2020.05.007
[49] McKeague, M. & Derosa, M. C. (2012), Challenges and opportunities for small molecule aptamer development. J Nucleic Acids. 2012. doi: https://doi.org/10.1155/2012/748913
[50] Komes, D., Horzic, D., Belscak, A., Kovacevic Ganic, K., & Baljak, A. (2009). Determination of Caffeine Content in Tea and Maté Tea by Using Different Methods. Czech Journal of Food Sciences, 27, 213-16. doi: https://doi.org/10.17221/612-cjfs
[51] Feng, S, Che, X., Que, L., Chen, C., & Wang, W. (2016). Rapid detection of theophylline using aptamer-based nanopore thin film sensor. IEEE, 1-3. doi: https://doi.org/10.1109/ICSENS.2016.7808959
[52] Yemele Tajeu, K., Ymele, E., Zambou Jiokeng, S. L., & Kenfack Tonle, I. (2018). Electrochemical Sensor for Caffeine Based on a Glassy Carbon Electrode Modified with an Attapulgite/Nafion Film. Electroanalysis, 31(2), 350-356. doi: https://doi.org/10.1002/elan.201800621
[53] Sarath Babu, V. R, Patra, S., Karanth, N. G., Kumar, M. A., Thakur, M. S. (2007). Development of a biosensor for caffeine. Anal Chim Acta, 582(2), 329-34. doi: https://doi.org/10.1016/j.aca.2006.09.017
[54] Du, C., Ma, C., Gu, J., Li, L., & Chen, G. (2020). Fluorescence Sensing of Caffeine in Tea Beverages with 3,5-diaminobenzoic Acid. Sensors, 20(3), 819. doi: https://doi.org/10.3390/s20030819
[55] Csótó, M. (2015). Mobile Devices in Agriculture: Attracting New Audiences or Serving the Tech-Savvy. Journal of Agricultural Informatics, 6(3). doi: https://doi.org/10.17700/jai.2015.6.3.227
[56] Griesche, C., Baeumner, A. J. (2020). Biosensors to support sustainable agriculture and food safety. TrAC Trends in Analytical Chemistry, 128,115906. doi: https://doi.org/10.1016/j.trac.2020.115906
[57] El-Sharkawy, M. A. (2006). Utility of Basic Research in Plant/Crop Physiology in Relation to Crop Improvement: A Review and a Personal Account. Braz. J. Plant Physiol, 18(4), 419-446. doi: https://doi.org/10.1590/S1677-04202006000400001
[58] Berbiye, I. Y. (2014). Raw Cocoa (Theobroma cacao L.) Quality Parameters - with special Reference to West Africa [Doctoral dissertation, University of Hamburg].
[59] V. Jegadeeswari, & Arunkumar, K. (2019). Evaluating the processed beans of different cocoa (Theobroma cacao L.) accessions for quality parameters. Journal of Phytology, 11(1), 01-04. doi: https://doi.org/10.25081/jp.2019. v11.3827
[60] Gotawska, S, Sprawka, I., Lukasik, I., & Gotawski, A. (2014). Are naringenin and quercetin useful chemicals in pestmanagement strategies. Journal of Pest Science, 87(1), 173-180. doi: https://doi.org/10.1007/s10340-013-0535-5
[61] Sosa, M. E., Guerreiro, E., Giordano, O. S., & Tonn, C. E. (2000). Bioactividad de flavonoides sobre larvas de Tenebrio molitor (Coleoptera: Tenebrionidae). Rev. Soc. Entomol. Argent., 59(1-4), 179-184. https://www.biotaxa.org/RSEA/article/view/32428