

Modeling and analysis of a prestressed girder bridge prior to diagnostic load testing
Modelación y análisis de un puente de vigas preesforzadas previo a una prueba de carga de diagnóstico
ACI Avances en Ciencias e Ingenierías
Received: 15 May 2021
Accepted: 06 October 2021
Resumen: El deterioro progresivo es un problema que afecta la infraestructura vial, especialmente a puentes. Esto requiere del desarrollo de métodos para determinar su influencia en el comportamiento estructural, siendo uno de ellos las pruebas de carga. Dentro de las pruebas de carga, los modelos en elementos finitos se utilizan como parte del proceso de preparación. El presente estudio se enfocó en la modelación y análisis de la respuesta estática del puente sobre el río Lili en Cali, Colombia, un puente de vigas preesforzadas programado para someterse a una prueba de carga de diagnóstico. Un modelo lineal en elementos finitos fue creado y variaciones a la rigidez de diafragmas y neoprenos fueron aplicadas. El análisis incluyó la obtención de la posición crítica de los vehículos de diseño, la distribución transversal de esfuerzos e influencia de los parámetros de variación en la respuesta de la estructura. Los resultados mostraron que las respuestas críticas se dieron con cargas cercanas a las vigas exteriores y que la variación de los parámetros no influyó significativamente en la respuesta estructural del puente. Los factores de distribución de carga en vigas se contrastaron con investigaciones anteriores, encontrando similitudes en forma y valor. Finalmente, se propuso un plan de instrumentación. Los hallazgos muestran cómo los modelos lineales en elementos finitos proporcionan información relevante con respecto a la posición crítica, la distribución de esfuerzos y la respuesta esperada bajo cargas de diseño.
Palabras clave: posición crítica, método de elementos finitos, factores de distribución de carga en vigas, plan de instrumentación, análisis estático.
Abstract: Progressive deterioration is a problem that affects road infrastructure, especially bridges. This requires the development of methods to determine its influence on structural behavior, one of them being load testing. Within load testing, finite element analysis (FEA) models are used as part of the preparation process. This study focused on the modeling and analysis of the static response of the bridge over the Lili River in Cali, Colombia, a prestressed girder bridge programmed to undergo a diagnostic load test. A linear FEA model was created, and variations were applied to the stiffness of diaphragms and elastomeric bearings. The analysis included obtaining the critical position for the design vehicles, the transversal distribution of stresses, and the influence of the variation parameters in the structural response. Results showed that the critical responses were with loads close to the exterior girders and that the variation of parameters did not significantly influence the structural response of the bridge. Girder Distribution Factors (GDF) were contrasted with previous research, finding similarities in shape and value. Finally, an instrumentation plan was proposed. The findings show how linear FEA models provide relevant information regarding the critical position, the distribution of stresses and the expected response under design loads.
Keywords: critical position, finite element method, Girder Distribution Factors, instrumentation plan, static analysis.
INTRODUCTION
The progressive deterioration of road infrastructure is a threat to the continued operation of the road network. In the case of the United States, 36% of bridges need structural repair, rehabilitation or replacement, which includes 7.3% of bridges classified as structurally deficient [1]. Equally, an analysis carried out on 2000 bridges in Colombia showed that 28% of structures present significant damage, and 4% have serious damage and risk of collapse [2]. Bridges, as well as other infrastructures, must guarantee safety in their use, and their assessment is a present necessity.
Load testing of bridges is a method that allows the assessment of bridge performance, especially when analytical methods do not provide accurate answers about the bridge’s behavior [3]. Load testing can be categorized into two groups: diagnostic load tests and proof load tests, the main difference being the applied load value and the test purpose. While diagnostic tests involve fractions of the design live load, proof tests use the full factored load required by the codes [3] [4]. Diagnostic load tests allow the measurement of real responses of a structure to known loads, with the purpose of using this information to calibrate analytical models that can later predict responses to higher loads [5]. The results obtained from these tests make it possible to verify design considerations or assumptions, measure the stress to which components or members of the structure are subjected, and accurately characterize the load distribution [3] [4] [6]. Load testing provides engineers relevant information in order to make decisions on the future use of bridges.
Regardless of the type of load test, there are stages that allow the test to be carried out successfully. These stages are the preparation, the execution, and the analysis of results [3]. In particular, the preparation stage consists in defining the most appropriate type of load test and the objectives, producing safety and instrumentation plans, and other elements that will then be used in the following phases of the test. In this stage, finite element models play an important role by providing information to [3]:
Identify secondary and non-structural elements that can affect the response of the bridge to loads.
Develop predictions of the response to choose the correct instrumentation and guarantee the safety of the test.
Create an instrumentation plan based on positions of interest.
The information obtained from finite element analysis (FEA) models includes the critical positions according to the stress or force being analyzed, the most common being bending moment and shear force. The critical position indicates the location of the load where these effects reach their maximum values, and they are calculated based on the design vehicles provided by the codes.
Given that the development of FEA models is closely related to the preparation of diagnostic load tests, the accuracy of the information is a priority for these tests to be conducted correctly. This includes the critical position of design vehicles, which will help obtain not only an order of magnitude for resultants of interest, but also the load distribution capacity of the structure and the most relevant locations for instrumentation [7]. It also measures the influence of secondary and non-structural elements that can later help improve analytical models in the post-processing phase. Based on the above, the objective of this work is to study the behavior, stress distribution and maximum expected responses of the bridge over the Lili River, a prestressed girder bridge located in Colombia, under design loads. This study plans to address the validity of linear FEA models to obtain initial but relevant information about the structural behavior of the bridge and the influence of the load-carrying capacity of diaphragms and the stiffness of the elastomeric bearings in its response. The purpose is providing high-quality results that can later help adjust analytical models with experimental information.
METHODS
Description of the bridge
The bridge over the Lili River (see Fig. 1), built in the 2000s, is located in the neighborhood Ciudad Jardin, Cali, Colombia. It consists of two lanes with the same traffic direction. A twin bridge next to it, structurally independent, carries traffic in the opposite direction. This structure is a prestressed girder bridge with a 19 m span, a 12.2 m width, and no intermediate supports. The deck sits on seven prestressed I-beams, and there are also four diaphragms, two in the extremes and two positioned at one third of each support. The plans for the bridge were not available, so the geometry, shown in Fig. 2, was obtained by a manual survey, with long tape measure.
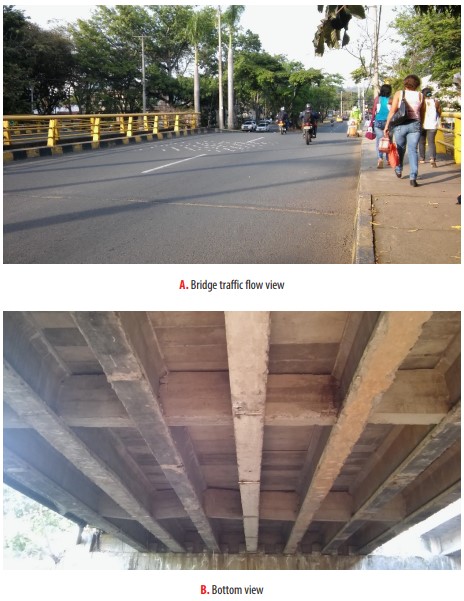
Photographs of the bridge over the Lili River
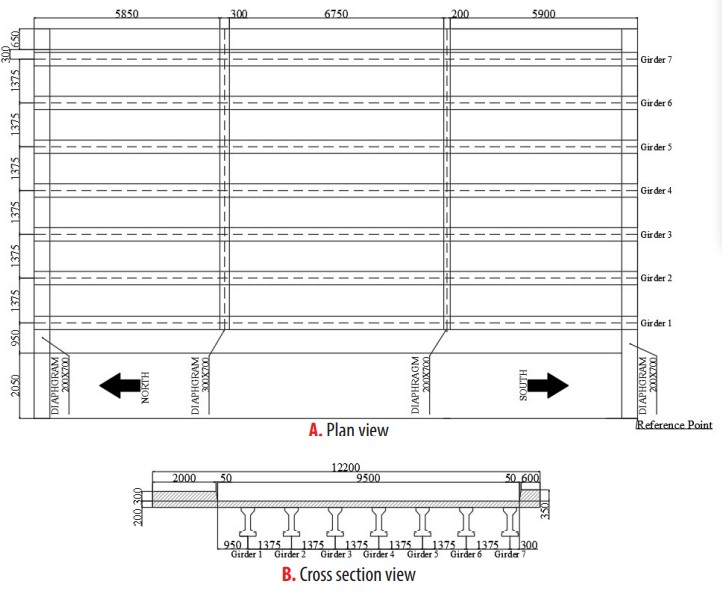
Plan of the bridge over the Lili River (mm)
Modeling choices
The program used to model and analyze the bridge was SCIA Engineer 20.0, a Finite Element Analysis (FEA) software [8]. This structural engineering program allowed the creation of a linear FEA model of the bridge shown in Fig. 3, with approximately 23000 nodes and an average size of 2D elements of 0.1 m. Linear analyses are applicable when stresses remain within the elastic range of the materials, as expected during the load test.
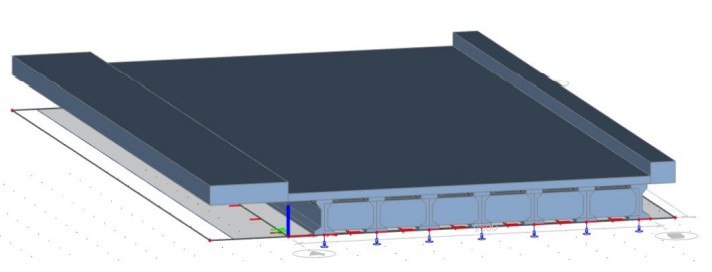
3D Model of the bridge SCIA Engineer
The girders, whose geometry is shown in Fig. 4, were defined as 1D beam elements and later adjusted to plate ribs to create the connection between them and the slab, defining a composite section’s behavior. The four diaphragms were also modeled as 1D beam elements with a height of 0.7 m and a variable width. At last, the slab, with a thickness of 0.2 m, was modeled as a 2D plate and analyzed with Mindlin-Reissner plate theory, since the thickness is greater than one tenth of the spacing between girders [9].
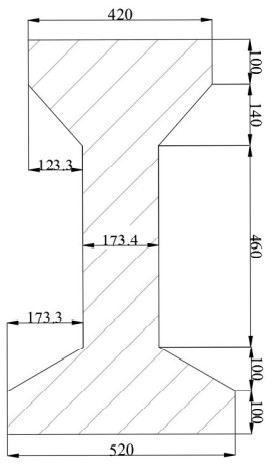
Dimensions of girder (mm)
The information and plans from a similar bridge, also located in Cali, were used to estimate the material properties for the model. Table 1 shows the compressive strength of each structural element, and Tables 2 and 3 present the associated properties for these values. The modulus of elasticity for concrete, Ec, was calculated with Equation 1 [10]
 (1)
(1)where is the specified concrete compressive strength.
| Structural Element | Material | Compressive Strength (MPa) |
| Deck | Concrete | 28 |
| Girder | Concrete | 35 |
| Diaphragm | Concrete | Variable |
Materials and associated strength for linear model of the bridge
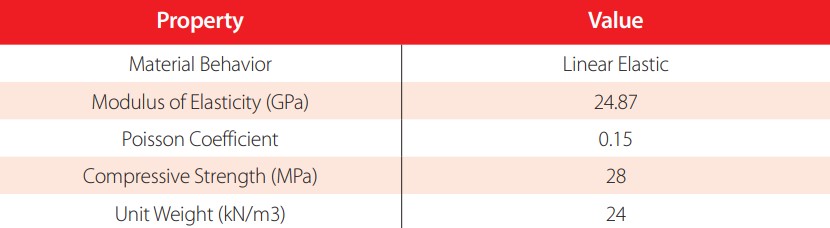
Material properties for 28 MPa concrete
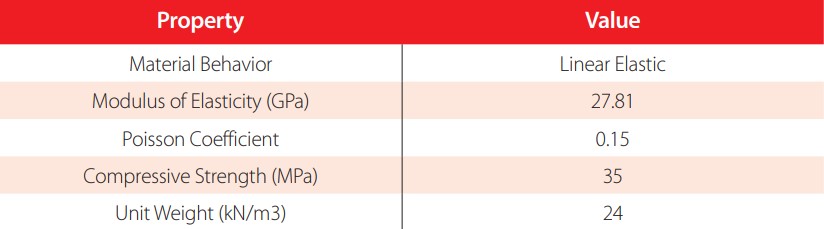
Material properties for 35 MPa concrete
As for boundary conditions, supports were located at the ends of each girder. The restrictions followed the guidelines of a simple support, but in the perpendicular direction a specific value for the stiffness was assigned to simulate the effect of the elastomeric bearings.
Parameter studies
In order to determine the effect of certain criteria on the behavior of the bridge, three variation parameters were proposed. The first one was the load-carrying contribution of diaphragms, where the modulus of elasticity was adjusted to simulate possible cracking of the concrete and its impact on the distribution of loads to the adjacent girders. The initial value of the modulus of elasticity was derived assuming a concrete compression strength of 28 MPa. The second value was an approximate 50% reduction on the first modulus of elasticity. The second parameter was the stiffness of the elastomeric bearings, which assumed three values. The first corresponded to the resistance of elastomeric bearings with a 50-year period of use, equal to 475 kN/mm [11]. The remaining two values corresponded to an approximate increase and decrease of 50% on the first value. In this way, the uncertainty on the real value was covered by a wide range of possible values for stiffness, which generally increases over time. Table 4 summarizes the information that was used for these two parameters. Finally, the third parameter was the transversal position of the lane. Six different lines were created, all aligned with the axis of the girders. These lines worked as guides for the location of the design vehicles’ loads, explained in the following section.
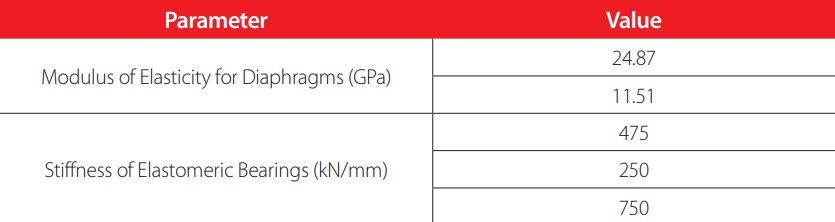
Quantitative variation parameters values
Loads
The loads considered in the model represent the design vehicles from the Colombian Code for Bridge Design (CCP 14), which specifies the design vehicle live load required for bridge design and analysis [12]. Two types of design vehicles were considered: a tandem and a truck. The design tandem consists of 125 kN twin axles 1.2 m apart, and with 1.8 m distance between the tires of an axle [12]. The design truck, see Fig. 5, consists of three axles, the front one having the lowest load. The distance between the two rear axles, sharing the same load value, must be varied within the specified range to find the most critical effect. The distributed lane load was not included in the model so that the results are consistent with the test, where the effect measured will be from the vehicles only.
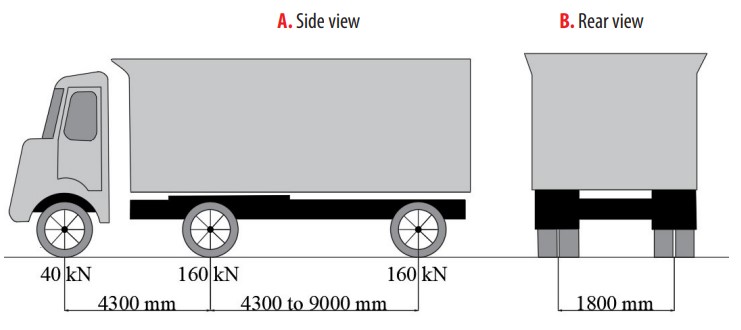
Geometry and axle loads for design truck
The two resultants of interest within the model were shear force and bending moment, and the proposed positions of the design vehicles answered to the maximum possible values for these forces. For shear, the rear axle of both vehicles was located at a distance of 0.12 m from the supports. This distance resulted in the highest shear response on the modeled structure, after a check on several positions on the edge. For the bending moment in the case of the tandem, the axles were centered within the span. For the truck, Barre’s Theorem was applied. This theorem states that “for a train of loads in a simply supported structure, the bending moment is maximum under the closest load to the midpoint, when that load and the resultant of the train of loads are located at symmetrical points regarding the midpoint of the load’s span” [13]. Therefore, the design truck’s longitudinal position for maximum bending moment is shown in Fig. 6. The direction of circulation is from south to north, and all mentions regarding distances are measured from the reference point indicated in Fig. 2.
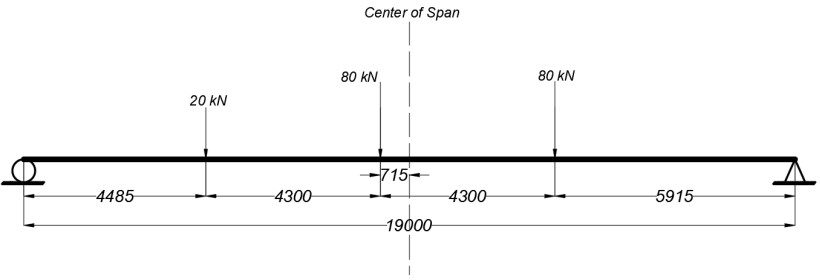
Design truck’s longitudinal position and wheel loads for maximum bending moment (mm)
As mentioned in the prior section, six lines, all aligned with the girders, were proposed to locate the vehicles in the transversal position. Given that the most critical case corresponds to two lanes loaded simultaneously, various load combinations were proposed to simulate this state, avoiding the overlap of loads and the possibility of two vehicles in the same lane. Fig. 7 shows all the proposed load combinations for maximum bending moment with the design truck, Fig. 8 for maximum shear force with the same vehicle, and finally Fig. 9 shows the load combinations for bending moment and shear force with the design tandem. The code used to refer to the different positions for the design vehicles, as well as the load combinations, includes letters and numbers, all explained in the legend of the aforementioned figures. Therefore, TM1 would refer to the position of the design truck (T) for maximum moment (M) in the transversal position associated with girder 1; and TM14 would mean the load combination of TM1 and TM4. In the case of shear, AS1 would refer to the position of the design tandem (A) for maximum shear (S) in the transversal position associated with girder 1; and AS14 would mean the load combination of AS1 and AS4.
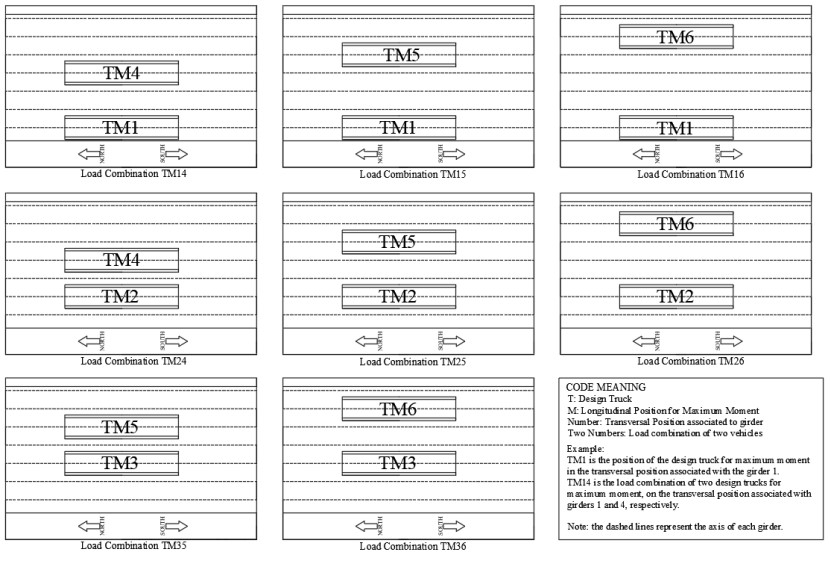
Load combinations for maximum bending moment for the design truck
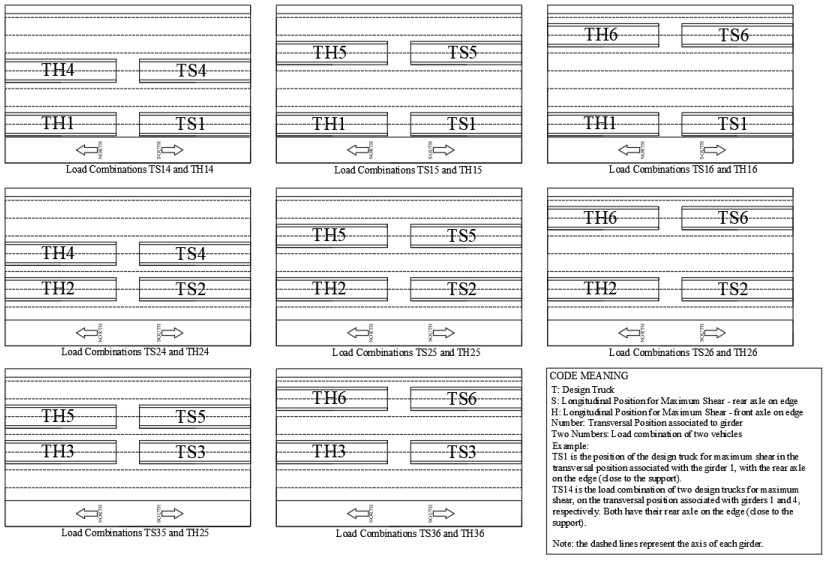
Load combinations for maximum shear force for the design truck
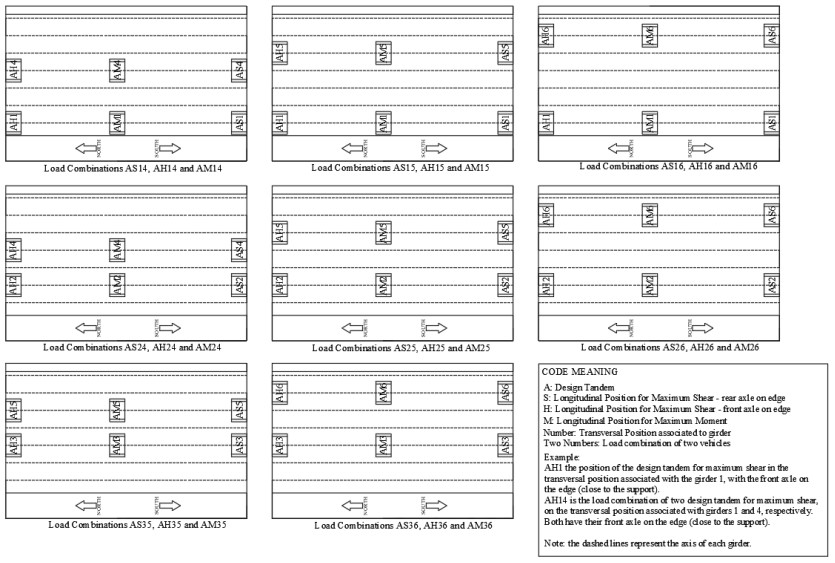
Load combinations for maximum shear force and bending moment for the design tandem
Some considerations were established to optimize the analysis and obtain only the most relevant information. The most critical results imply that the two vehicles are in the same longitudinal position. In addition, the distance between rear axles in the design truck, which initially must be varied in a range specified by the code, was set with the smallest value to generate the greatest effects, given that the bridge does not have intermediate supports. Finally, a total of six different analyses were carried out per design vehicle, resulting from the combination of the variation parameters previously discussed. These analyses are referred to as protocols, and the information regarding each one can be found in Table 5.
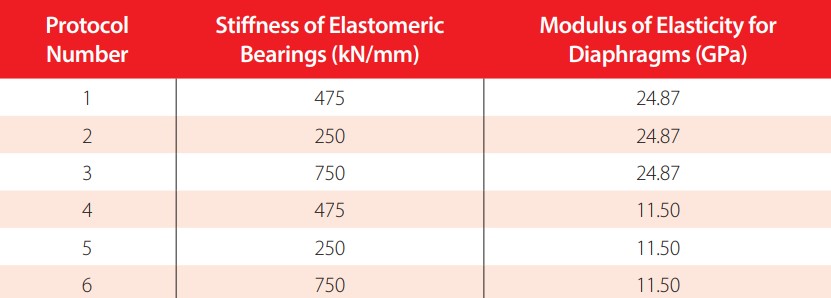
Values of variation parameters per protocol
RESULTS
Critical position for bending moment and shear force
The results obtained from the bridge analysis were based solely on the effect of the design vehicle’s live load and were obtained from the girders. It is expected that this consideration will be consistent with the experimental data from the load test, as it also only measures the effect of the applied live load.
The obtained critical position corresponds to the vehicle’s load combinations that caused the greatest response of shear force and bending moment in the girders of the bridge. For the design truck, the maximum values for shear force, bending moment and displacement are shown in Table 6. The load combinations that caused these values are TS14 and TM14, and the most affected girder was girder 1. Even though the critical position coincided in all six protocols, the presented reactions are from protocol 6, where the combination of variation parameters resulted in the highest structural response. The location of both trucks that resulted the most critical is transversally the closest to the left cantilever of the bridge (near to girder 1), which is coherent with the geometrical asymmetry of the bridge. For the design tandem, the analysis of the critical position was focused on verifying two aspects. The first aspect is that the maximum shear force and bending moment values did not exceed those obtained with the design truck. The second aspect is that the critical positions, corresponding to the combinations AM14 and AS14, were transversally the same as for the truck. Both assumptions were confirmed within the model.
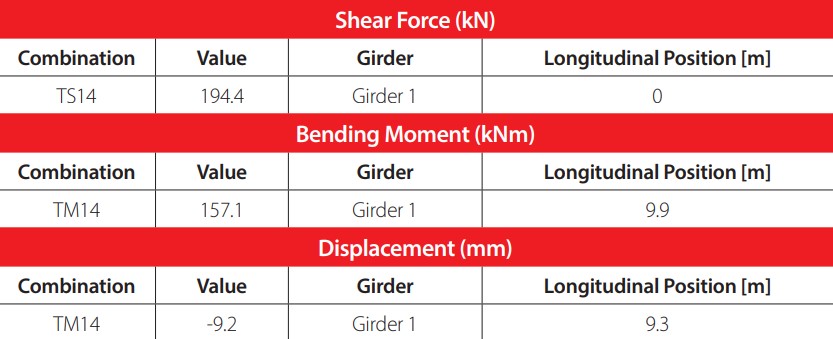
Maximum values for resultants with design truck
Influence of variation parameters
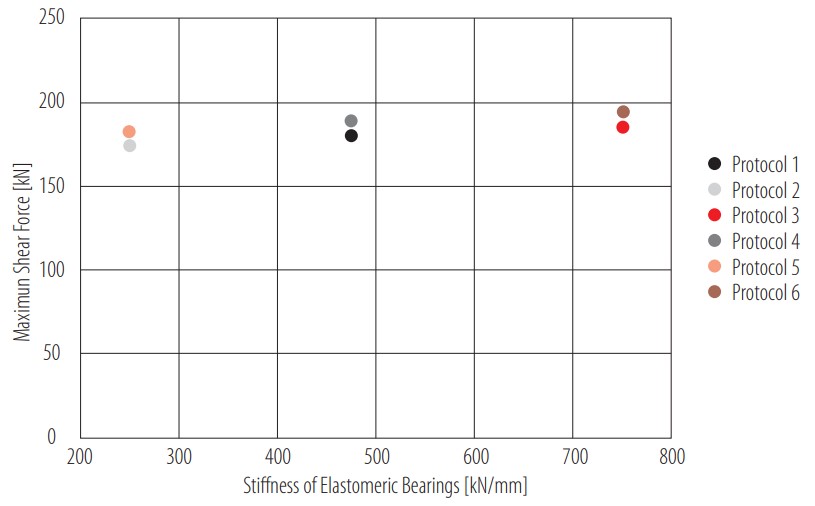
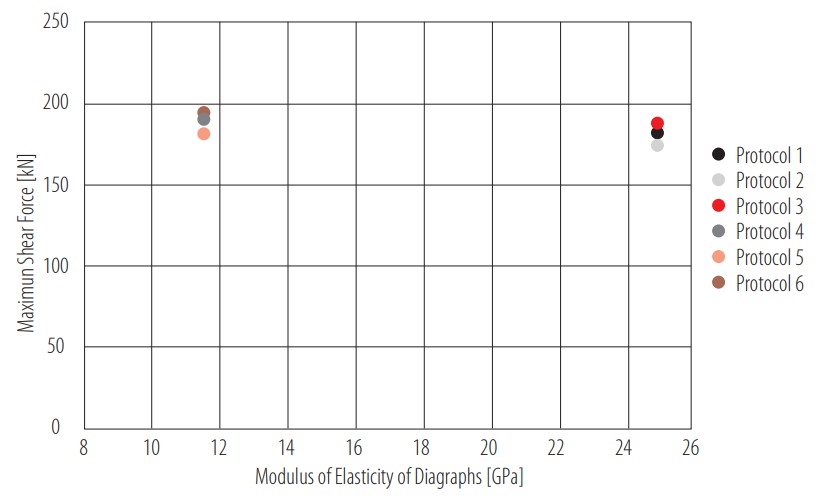
Influence of stiffness of elastomeric bearings on the maximum shear force
To analyze the influence of the stiffness of the elastomeric bearings in the behavior of the bridge, two graphs were made. The first one, shown in Fig. 10, represents the influence of this parameter on the maximum shear response for all six protocols. To quantify the impact of the proposed variation, a percentage difference was determined with Equation 2,

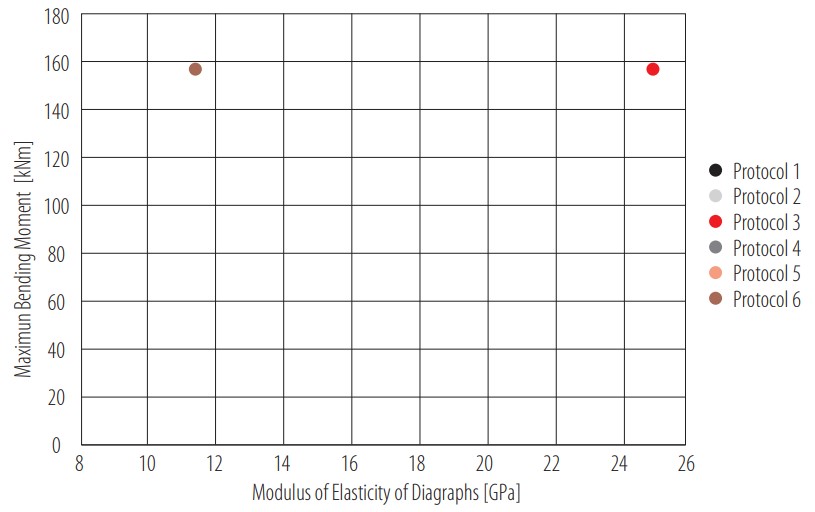
where and are the values to be compared [14]. The percentage difference was calculated separately for protocols 1 to 3 and protocols 4 to 6, considering both groups have the same diaphragms’ modulus of elasticity. The results showed a percentage difference of 3.1% and 3.3% respectively, resulting in an average of 3.2% of variation between shear force values caused by the change in the elastomeric bearings’ stiffness. The same calculation was made for the maximum bending moment response, shown in Fig. 11. For this reaction, the average percentage difference was barely 0.04%. It is expected that the effect is larger in shear force than in bending moment, because the elastomeric bearings are located in both ends of the bridge, where shear is governing. Both graphs showed that an increase in the stiffness of the elastomeric bearings increases the shear force as well. This increment in the shear response is a real effect in bridges because the stiffness of elastomeric bearings tends to increase over time. Within bridge assessment, underestimating this parameter will result in an underestimation of the maximum shear force and bending moment. Therefore, an increment in the value of stiffness, if the real value of this parameter is unknown, could avoid an error of this nature.
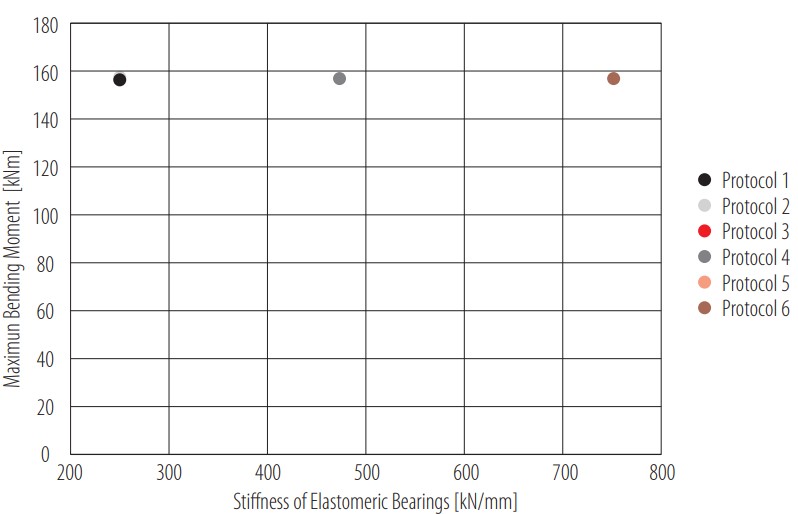
Influence of stiffness of elastomeric bearings on the maximum bending moment
Additionally, a similar analysis was made to evaluate the influence of the modulus of elasticity of the diaphragms in the response of the bridge. This time, the percentage difference was calculated for protocols 1 and 4, 2 and 5, and 3 and 6, which share the same elastomeric bearings stiffness. For shear force (see Fig. 12), the average percentage difference was 4.4%. For bending moment, shown in Fig. 13, the value reached 0.4%. This analysis revealed that an increase in the modulus of elasticity of the diaphragms results in a reduction of the shear force and bending moment responses. This too is an expected result, considering that a lower modulus of elasticity affects the transmission of loads to nearby girders and, therefore, the response to applied loads increases. As well as in the stiffness results, the shear response was the most affected by this variation. If this parameter is unknown, it is better to decrease the value to avoid an underestimation of the shear force or bending moment response. This reduction could be validated at an inspection if damage is located.
Influence of modulus of elasticity of diaphragms on the maximum shear force
Influence of modulus of elasticity of diaphragms on the maximum bending moment
As stated in Table 5, protocol 6 is integrated by the highest elastomeric bearing’s stiffness value and the lowest diaphragm’s modulus of elasticity. Based on the previous analysis, it is expected that the maximum values correspond to this protocol. Parameter variations are useful to assess whether the effect of these elements is representative on the response of a structure and to adjust analytical models with experimental information. The effect of the variation parameters was coherent with the expected behavior of the bridge. This includes an increase in shear force and bending moment consequent with the increase in the stiffness of the elastomeric bearings and a decrease in the same parameters due to the increase in the modulus of elasticity of the diaphragms. The analysis showed that the protocols did register a change in the values for shear force and bending moment as a result of these variations; however, the critical position and most affected girder remained the same through all the protocols. This demonstrates that the influence of the elastomeric bearings’ stiffness and the diaphragms’ modulus of elasticity is not relevant enough to produce significant changes in the behavior of the bridge.
Recommendations on position of instrumentation
The application of finite element models has several purposes within the preparation of load tests. One of these is the preparation of an instrumentation plan according to positions of interest. Based on the critical position obtained in the analysis, recommendations can be given to obtain the most relevant results.
Regarding bending moment, strain gauges are a commonly used type of instrumentation because the measured strain can later be converted to these forces using the cross section [15]. The suggested location for these sensors (see Fig. 14) is where the maximum bending moment is expected, and in order to guarantee redundancy and verify the reliability of the data, several gauges must be available for each location [3] [15]. Therefore, it is suggested that at least two gauges be located in the bottom flange of the girders. Also, to verify the linear strain profile assumed, two more gauges could be located in the top flange [3]. This location in height can also help determine if the girders and the slab are working as a composite section, which could be an assumption included in the FEA model.
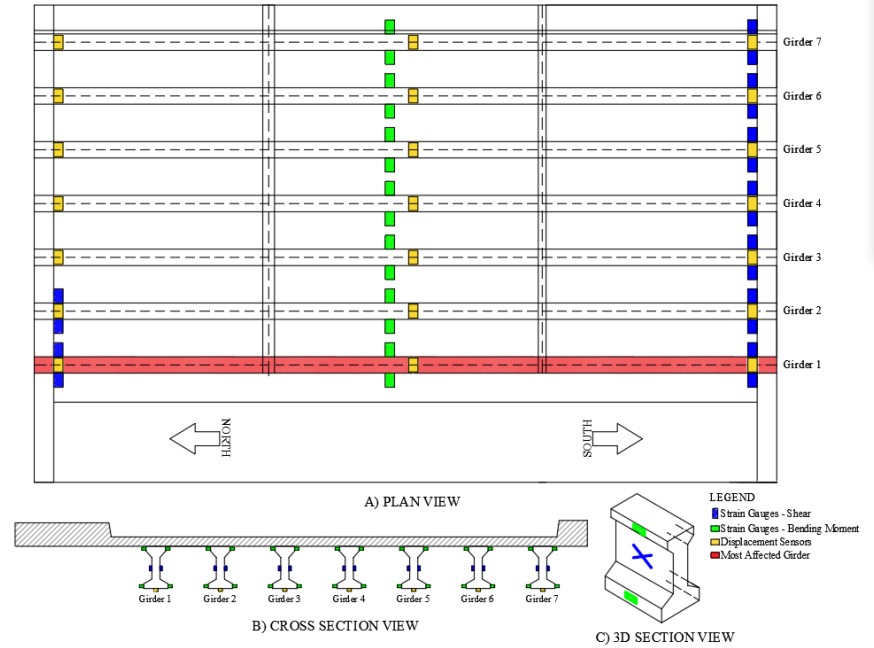
Proposed plan of instrumentation
Based on the preliminary assessment of the bridge, shear is not an expected failure mechanism in the structure, so its measurement in the diagnostic load test might not be a priority. Either way, a proposed sensor’s position for this load effect is also presented in Fig. 14. For shear force measurement, strain gauges are also used, but the position is in the girder’s web. Factors like the geometry of the bridge, the girders’ cross-sections and the applied load could generate an out-of-plane bending [16]. Knowing that this phenomenon could affect measurements, it is recommended that at least two gauges be located in the points of interest, one at each side of the web, so that data can be averaged and a possible out-of-plane bending effect countered.
For vertical displacement, displacement sensors are also included in the proposed plan. The position close to mid-span corresponds to the expected location of the largest response, and the position close to both supports works as a reference point for the measurements, especially considering that the stiffness of the elastomeric bearings is unknown. In order to guarantee redundancy, a total of three Linear variable differential transformer (LVDT) sensors are located on each girder, as shown in Fig. 14.
Analysis
This study focused on the modeling and analysis of the bridge over the Lili River, which is programmed to undergo a diagnostic load test. The objective of the analysis was to obtain the critical position of the design vehicles, as part of the preparation stage of this test. Because the plans of the bridge were not available, variation parameters for the elastomeric bearings’ stiffness and the diaphragms’ modulus of elasticity were proposed to measure their affectation in the overall response of the bridge.
It was found that the critical position for both vehicles and for bending moment and shear force shared the same axle positions transversally. Regarding maximum shear, the position of the back axles also coincided for both vehicles longitudinally. For maximum bending moment, due to the geometry of the vehicles, the position was no longer related. It was also found that the most affected girder was the same in both cases.
The load combinations corresponding to the design truck caused the highest responses for bending moment and shear force in the model. The longitudinal critical position proposed for the truck was based on Barre’s Theorem, which is used to find the maximum bending moment of a train of loads [13]. This theorem is based on a simply supported beam, which shows the limitations within its application. Given that this concept was applied to a more complex structural system, composed of several girders, it was expected that the finite element analysis showed variations in regard to the expected location of the maximum bending moment. According to the theorem, the maximum value should be located in the closest load to the midspan, corresponding to a distance of 10.2 m measured from the reference point. On the other hand, the model revealed the location of maximum bending moment at 9.9 m. The corresponding value for bending moment for the first distance is 156.4 kNm, while for the second is 157.1 kNm. A percentage difference was calculated for both distance and bending moment values. The variation in the distance was of 3.1%, while for the bending moment the difference was quantified as 0.4%. Both values can be considered low in relation to the contrast that exists between the finite element model of the bridge and the simplified model for the theorem. These observations are considerable because they show how, when analyzing simple span prestressed girder bridges, Barré’s Theorem can provide an accurate critical position for trains of loads to cause the largest bending moment response.
To analyze how the loads were being distributed transversally, the Girder Distribution Factors (GDF) were determined for the two most critical cases of loading in the bridge, corresponding to TM1 and TM14, by applying Equation 3,
 (3)
(3)where is the live-load bending moment at girder i, and n is the total number of girders [17]. For this calculation, the moments for all the girders, measured in reference to the point of maximum bending moment on girder 1, were used. Fig. 15 shows the GDF for each girder in the aforementioned load scenarios. These values can be contrasted with the research of Eamon, Chehab and Parra-Montesinos on two prestressed concrete girder bridges for live-load distribution, where a comparison of microstrain vs. girder for two tested bridges and a FEA model was made [17]. The corresponding load to these values was from a single truck located transversally at the edge of the bridge and longitudinally at mid-span for maximum bending moment response, which is highly similar to the location for one truck, named TM1, proposed in the present work. Even though in both graphs (Fig. 15 and the cited research) the y-axis represents a different parameter, GDF can be obtained from bending moment and deformation assuming that the Young’s modulus and section modulus are the same for all girders [18]. When contrasting the two mentioned diagrams, a similarity in shape is recognizable. For both models, the GDF is the largest in the closest girder to the load and decreases until reaching negative values in the furthest beam, which represents negative bending moment or deformation. Eamon, Chehab and Parra- Montesinos also showed that the values from their FEA model were remarkably similar to the results from their two tested bridges, which opens the possibility of contrasting their experimental data with Fig. 15. The contrast was established with positions TM1 and TM14. For position TM1, the experimental GDF for positive bending moment in an exterior girder is 0.35 and 0.36 for bridges 1 and 2 from the above-mentioned research [17]. On the other hand, as can be observed in Fig. 15, the maximum GDF for TM1 in the proposed LFEA model is 0.36. For position TM14, the experimental GDF from the referenced work is 0.26 and 0.22 for bridges 1 and 2, correspondingly [17]. The obtained value from the proposed model is 0.22. Given the close similarities between the FEA model of the bridge over the Lili River and the experimental values from the research of Eamon, Chehab and Parra-Montesinos, the use of linear FEA models can be highlighted as a reliable method to obtain initial information and analyze the transversal distribution of stresses in prestressed concrete girder bridges.
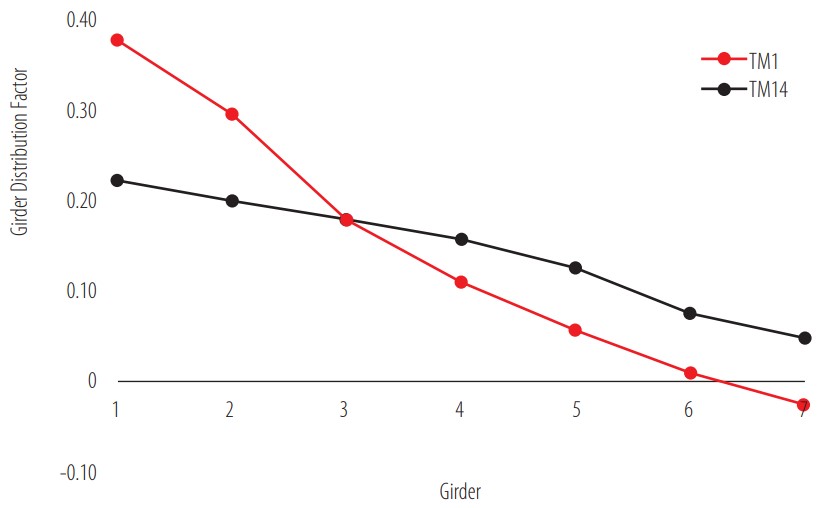
Girder Distribution Factors (GDF) for maximum bending moment
In the case of shear force, the GDFs from the LFEA model can be compared with the research of Huang, Wang and Shahawy on multigirder concrete bridges [19]. This research consisted of the analysis of the impact behavior of multiple vehicles on seven modeled prestressed concrete girder bridges [19]. The design vehicle was the HS20-44 truck, a vehicle resembling the one used in the present work. As part of the study of the effect of vehicle weight, a static distribution for asymmetric loading on the form of a GDF vs. number of girder graph is presented in the mentioned research. In this case, the distribution factors were calculated with Equation 4,
 (4)
(4)where is the maximum shear force on the i girder, is the sum of shear force of all girders at one section, and n is the number of wheel loads in the transverse direction [19]. To establish a comparison, Fig. 16 was generated using the values of shear force from all girders in reference to the point of maximum shear for girder 1, with the load combination TS1. As well as for the distribution factors for bending moment, Fig. 16 has similarities with the cited research in terms of shape and order of magnitude of GDF. The difference between both maximum GDFs can be related to the transversal position of the truck. Even though for both cases the load is asymmetric, in the research of Huang, Wang and Shahawy the truck was located in between two girders, while the position TS1 consists of the truck being aligned with girder 1. This factor could also explain the representative difference between the GDF for girder 1 and girder 2 in Fig. 16. This contrast shows that, as stated before for bending moment, the proposed FEA model provided initial information on what to expect from the transversal stress distribution for shear in concrete girder bridges.
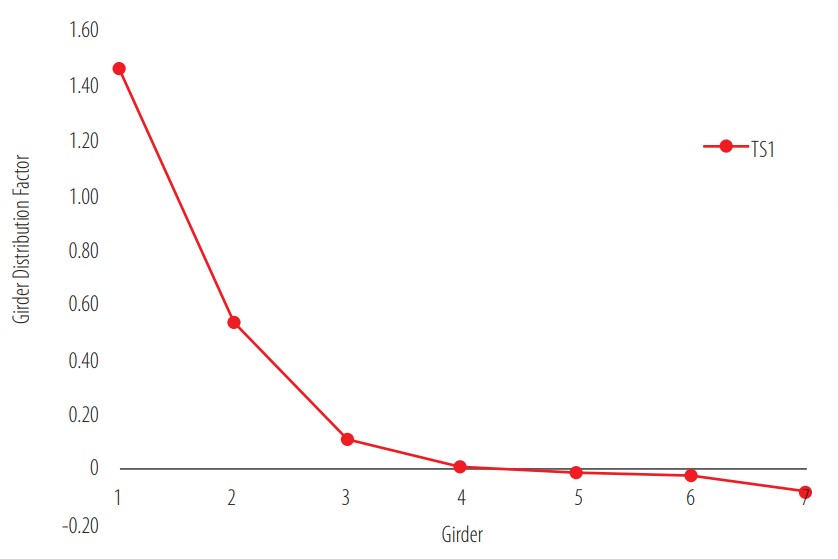
Girder Distribution Factors (GDF) for maximum shear force
The negative values in girder 7 presented in Figs. 14 and 15 show that the positions TM1 and TS1 caused an upward deflection on the farthest girder from the load. This finding is consistent with the previously mentioned research of Eamon, Chehab and Parra-Montesinos, where this behavior was first found in the load tests and later confirmed with a simple FEA model [17]. Araujo, in his research on prestressed concrete bridges, also obtained negative microstrains in the girder at the opposite side of his analyzed bridge after conducting a load test with a load combination similar to TM14 [20]. These findings show that eccentric loads can generate negative bending moment in the girders opposite the vehicle load, which is something to consider when analyzing experimental data from the diagnostic load test.
DISCUSSION
The modeling and analysis of the bridge over the Lili River revealed valuable information regarding the use of LFEA models in the preparation stage of diagnostic load tests. These elements include the effectiveness of the use of simplified models to obtain the critical position of design vehicles, a transversal distribution of stresses and an order of magnitude for bending moment and shear responses.
Transversal distribution of stresses
The analysis of the FEA model with the loads corresponding to the design vehicles showed that the critical position was TM14 and that girder 1 was the most affected by the static loads. This exterior girder supported the highest bending moment and shear responses when the two trucks were located at the closest points from it. Regarding the other exterior girder, position TM36 was the closest to it, but since the discrete positions of the trucks were aligned with the center axis of the girders, the vehicles were not close enough for the most affected girder to be number 7. In order to verify if the exterior girders are expected to endure the highest responses, a modification to position TM36, consisting of moving TM3 and TM6 0.8 m transversally, was made to achieve the vehicle’s closeness to girder 7. With this new position, the maximum bending moment reached 157 kNm in girder 7.
To establish a comparison, a third value from TM35, equal to 144.4 kNm and associated to girder 4, was also considered. When contrasting the values from TM14 (Table 6), TM35 and the new position, it was revealed that the exterior girders 1 and 7 have the highest responses when the position ofthe trucks is sufficiently close to them. The same analysis was repeated for shear force, arriving to the same conclusion. This finding coincides with the aforementioned research on two prestressed concrete girder bridges conducted by Eamon, Chehab and Parra-Montesinos, which showed that, when contrasting experimental results, the largest responses were from an exterior girder if the position of the vehicle was above or sufficiently close to it [17].
This information proves that linear FEA models can provide initial but relevant information with regard to the transversal stress distribution for shear and bending moment responses in the girders. Also, knowing that the highest resultants will come from exterior girders can be used to propose other positions for the vehicles depending on the resources and the goals of the load test.
Parameter studies
To analyze the influence of the elastomeric bearings’ stiffness and the diaphragms’ modulus of elasticity, both parameters were varied with several values, resulting in a total of six protocols. The results showed that the critical position of the design vehicles remained the same for all the protocols and that the variations in the bending moment and shear resultants for each scenario were not significant.
Regarding the stiffness of the bearings, the finding is consistent with the research conducted by Green, Yazdani and Spainhour on the contribution of intermediate diaphragms in enhancing precast bridge girder performance [21]. They concluded that, even though the increase in the stiffness of elastomeric bearings decreases the maximum girder deflection, this effect is minimum. The maximum deflections from protocol 5 and 6 support this observation, with a difference that barely reached 3.2%.
The influence of diaphragms has been previously analyzed in the research by Schwarz and Laman on the response of prestressed concrete I-girder bridges to live load [22]. They determined that the variation percentage in the response of a structure is low if diaphragms are introduced in a FEA model. This observation is consistent with this study, where the consideration of different modulus of elasticity for these elements resulted in a minimal influence on the behavior ofthe bridge.
Even though neither parameter produced significant changes in the considered resultants, the influence analysis made it possible to establish certain recommendations in case the information was required but not available. Based on the results, it is recommended to model diaphragms with low modulus of elasticity and elastomeric bearings with high stiffness. This way, an underestimation in the response for bending moment and shear force can be avoided.
The information that this study provides about parameter studies shows that, in the preparation stage of a diagnostic load test, LFEA models can be simplified, and parameter studies omitted, without resulting in relevant changes in the results. This simplification can be translated into a reduction in computational time when certain elements, like intermediate diaphragms, are excluded from the model. Also, it removes the difficulties in determining specific values, like the stiffness of elastomeric bearings, which may not be available.
The findings in this study show that LFEA models provide relevant information that proves useful for diagnostic load tests and that its reliability will not be affected by its simplification. The refining efforts of a FEA model regarding secondary and non- structural elements could be focused instead as a post-processing goal that can be worked alongside the experimental data from the test.
CONCLUSIONS
The results of the modeling and analysis of a prestressed girder bridge prior to a diagnostic load test led to the following particular conclusions:
The critical position of the design vehicles was determined. For the design truck, TM14 and TS14, consisting of loads closest to exterior girder 1, proved to be the most critical load combinations for bending moment and shear force, respectively. For the design tandem, the load combinations AM14 and AS14 produced the largest responses, but they did not exceed the values generated by the truck. For both maximum bending moment and shear force, these positions match transversally for the truck and the tandem. This provides a wide range in geometry and load value for the critical position of the load test vehicle to coincide as well.
The values for maximum bending moment and maximum shear force from the combinations TM14 and TS14 were 157.1 kNm and 194.4 kN, measured from girder 1.
Due to the lack of plans and design specifications, it was decided to vary the modulus of elasticity of the diaphragms and the stiffness of the elastomeric bearings and evaluate their influence. Even though protocol 6 resulted in the highest bending moment and shear responses, the results showed no significant impact ofthese parameters on the behavior ofthe bridge. This analysis demonstrates that simplified FEA models provide accurate initial information regarding the overall behavior of a bridge and that the effort in refining FEA models can be part of the post-processing stage instead.
A proposal of instrumentation, focused on the main elements of the bridge, was created based on important locations identified in the critical position analysis. These locations include the most affected girder and the zones where maximum bending moment and shear force are expected. The proposal is based on ensuring the redundancy and reliability of the experimental data collected from the test, as well as evaluating the assumption of a composite section.
To analyze the bending moment and shear force transversal distribution, a contrast was made between the Girder Distribution Factors (GDF) found in the proposed LFEA model and other research on prestressed concrete girder bridges. The comparison revealed similarities that validate the use of LFEA models as a first approximation to study the load transmission capacity of structures.
A comparative analysis with load combinations TM14, TM35 and an additional position close to girder 7 showed that exterior girders present the highest responses for bending moment and shear force when the position of the vehicle is above or sufficiently close to them. This demonstrates that, when defining the position of the vehicle in a diagnostic load test, locations close to exterior girders will provide the most critical results.
The overall conclusion drawn from this study is that the use of linear FEA models provides relevant information for diagnostic load tests, including the critical position of design vehicles, the distribution of stresses, and the expected values for bending moment and shear under design loads.
AUTHORS’ CONTRIBUTIONS
Eva O. L. Lantsoght, Johannio Marulanda Casas and Sebastián Castellanos-Toro conceived the research; Johannio Marulanda Casas and Sebastián Castellanos-Toro made the geometric survey ofthe bridge; Emilia A. Andrade Borges developed the linear FEA model, processed the information and drafted the article; Eva O. L. Lantsoght and Sebastián Castellanos-Toro carried out a critical revision of the article; Eva O. L. Lantsoght, Johannio Marulanda Casas and Sebastián Castellanos-Toro approved the final version to be published.
CONFLICTS OF INTEREST
All authors declare that they have no conflicts of interest.
References
American Road & Transportation Builders Association (ARTBA). (2021). Bridge Conditions Report. Washington, D.C. Retrieved from https://artbabridgereport.org/reports/2021-ARTBA-Bridge-Report.pdf
Muñoz, E., & Gómez, D. (2011). Análisis de la evolución de los daños en los puentes de Colombia. Bogotá: Pontificia Universidad Javeriana.
Transportation Research Board. (2019). Primer on Bridge Load Testing. Transportation Research Circular, no. E-C257. Retrieved from http://onlinepubs.trb.org/onlinepubs/circulars/ec257.pdf
Lantsoght, E. (2017). Proof load testing of reinforced concrete bridges: Experience from a program of testing in the Netherlands. 1er Congreso Iberoamericano de Ingeniería Civil. Retrieved from: http://pure.tudelft.nl/ws/portalfiles/portal/30723991/Proof_load_testing_of_reinforced_concrete_bridges_Ing._Eva_Lastsoght.pdf
Wang, C., & Zhang, H. (2020). A probabilistic framework to optimize the target proof load for existing bridges. Innovative Infraestructure Solutions. doi: https://doi.org/10.1007/s41062-020-0261-9
Alampalli,S., Frangopol, D., Grimson, J., Halling, M., Kosnik, D., Lantsoght, E., Yang, D., Zhou, Y. (2020). Bridge Load Testing: State-of-the-practice. ASCE. doi: 10.1061/(ASCE)BE.1943-5592.0001678
Lantsoght, E., de Boer, A., van der Veen, C., Hordijk, D. (2019). Optimizing Finite Element Models for Concrete Bridge Assessment with Proof Load Testing. Frontiers in Built Environment. doi: 10.3389/fbuil.2019.00099
Nemetschek Group. (2011). Basic Concept Training Scia Engineer 2011.0. Hasselt.
Timoshenko, S. & Woinowsky-Krieger, S. (1987). Theory of Plates and Shells. McGraw-Hill.
American Concrete Institute (2014). Building code requirements for structural concrete (ACI 318-14). ACI Committee 318.
Reinders, S. (2016). Service life monitoring of concrete bridges. Delft: Delft University of Technology.
Asociación Colombiana de Ingeniería Sísmica - AIS. (2014). Norma Colombiana de Diseño de Puentes CCP14. Bogotá D.C.
Torres, E. (2013) Diseño de Puentes - Interpretación del código AASHTO. Quito: Abya - Yala.
Cole, T.J., & Altman, D.G. (2017). Statistics Notes: What is a percentage difference?. BMJ Research Methods & Reporting. doi: https://doi.org/10.1136/bmj.j3663
Lefebvre, P. (2010). The instrumentation, testing, and structural modeling of a steel girder bridge for long-term structural health monitoring. Master’s Theses and Capstones, University of New Hampshire. Retrieved from: https://core.ac.uk/download/pdf/215515969.pdf
Lobo, S., & Christenson, R. (2018). A simplified shear-strain based bridge weigh-in-motion method for in-service highway bridges. Métodos & Materiales, 8, 11-22. doi: https://doi.org/10.15517/mym.v8i1.34551
Eamon, C., Chehab, A., & Parra-Montesinos, G. (2016). Field Tests of Two Prestressed-Concrete Girder Bridges for Live-Load Distribution and Moment Continuity. Journal of Bridge Engineering, 21(5). doi: https://doi.org/10.1061/(ASCE)BE.1943-5592.0000859
Idriss, R., & Liang, Z. (2010). In-Service Shear and Moment Girder Distribution Factors in Simple-Span Prestressed Concrete Girder Bridge: Measured with Built-in Optical Fiber Sensor System. Transportation Research Record: Journal of the Transportation Research Board, 2172(1). doi: https://doi.org/10.3141/2172-16
Huang, D., Wang, T.L., & Shahawy, M. (1993). Impact Studies of Multigirder Concrete Bridges. Journal of Structural Engineering, 119(8). doi: https://doi.org/10.1061/(ASCE)0733-9445(1993)119:8(2387)
Araujo, M.C. (2009). Slab-on-girder prestressed concrete bridges: linear and nonlinear finite element analysis and experimental load tests. LSU Doctoral Dissertations, 1119. Retrieved from: https://digitalcommons.lsu.edu/gradschool_dissertations/1119
Green, T., Yazdani, N., & Spainhour, L. (2004). Contribution of Intermediate Diaphragms in Enhancing Precast Bridge Girder Performance. Journal of Performance of Constructed Facilities, 18(3). doi: https://doi.org/10.1061/(ASCE)0887-3828(2004)18:3(142)
Schwarz, M., & Laman, J. (1999). Response of Prestressed Concrete I-Girder Bridges to Live Load. Journal of Bridge Engineering, 6(1). doi: https://doi.org/10.1061/(ASCE)1084-0702(2001)6:1(1)