COVID-19 ResNet: Residual neural network for COVID-19 classification with three-step Bayesian optimization
COVID-19 ResNet: Red neural residual para la clasificación de la COVID-19 con optimización bayesiana de tres pasos
ACI Avances en Ciencias e Ingenierías
Universidad San Francisco de Quito, Ecuador
Received: 13 May 2021
Accepted: 07 October 2021
Abstract: COVID-19 is an infectious disease caused by a novel coronavirus called SARS-CoV-2. The first case appeared in December 2019, and until now it still represents a significant challenge to many countries in the world. Accurately detecting positive COVID-19 patients is a crucial step to reduce the spread of the disease, which is characterized by a strong transmission capacity. In this work we implement a Residual Convolutional Neural Network (ResNet) for an automated COVID-19 diagnosis. The implemented ResNet can classify a patient's Chest-Xray image (CXR) as COVID-19 positive, pneumonia caused from another virus or bacteria, or healthy. Moreover, to increase the accuracy of the model and overcome the data scarcity of COVID-19 images, a personalized data augmentation strategy using a three-step Bayesian hyperparameter optimization approach is applied to enrich the dataset during the training process. The proposed COVID-19 ResNet achieves a 94% accuracy, 95% recall, and 95% F1-score in the test set. Furthermore, we also provide insight into which data augmentation operations are successful in increasing CNN performance when doing medical image classification with COVID-19 CXR.
Keywords: convolutional neural networks, deep learning, Bayesian optimization, medical image analysis, data augmentation, hyperparameters.
Resumen: La COVID-19 es una enfermedad infecciosa causada por un nuevo coronavirus llamado SARS-CoV-2. El primer caso apareció en diciembre del 2019 y hasta el momento sigue representando un gran desafío a nivel mundial. La detección precisa del virus en pacientes COVID-19 positivos es un paso crucial para reducir la propagación de esta enfermedad altamente contagiosa. En este trabajo se implementa una red neuronal residual convolucional (ResNet) para el diagnóstico automatizado de la COVID-19. La ResNet implementada puede clasificar la radiografía del tórax de un paciente en COVID-19 positivo, uno con neumonía causada por otro virus o bacteria, y un paciente saludable. Además, para aumentar la precisión del modelo y superar la escasez de imágenes médicas en el set de entrenamiento, se aplica una estrategia de aumento de datos personalizada utilizando una optimización bayesiana en tres pasos. La ResNet propuesta alcanza un 94% de precisión, 95% de sensibilidad y 95% en el F1-score en el set de prueba. Adicionalmente, presentamos las operaciones de aumento de datos que ayudaron a incrementar el rendimiento de la red neuronal y que pueden ser utilizados por otros investigadores en el desarrollo de modelos para la clasificación de imágenes médicas.
Palabras clave: redes neuronales convolucionales, aprendizaje profundo de máquina, optimización bayesiana, análisis de imágenes médicas, aumento sintético de datos, hiperparámetros.
INTRODUCTION
COVID-19 is a disease caused by a new coronavirus called SARS-CoV-2. The first reports of this new virus came from Wuhan, Republic of China. The most common symptoms associated with COVID-19 are fever, fatigue, and dry cough. Meanwhile, the most severe symptoms include shortness of breath, confusion, pressure in the chest and loss of appetite [1]. In comparison with severe acute respiratory syndrome (SARS) and Middle East respiratory syndrome (MERS), SARS-Cov-2 is characterized by a lower mortality rate but a stronger transmission capacity [2].
The initial screening methods for COVID-19 diagnosis are the Real-Time reverse transcription-Polymerase Chain Reaction test (RT-PCR), antibody test (serology), and auxiliary diagnosis tests like computed tomography (CT) and chest X-ray (CXR) [2]. The RT-PCR test is recommended for people who have shown symptoms of the Coronavirus, people who have been in contact with a confirmed case, and people who have been traveling or participating in social events [3]. On the other hand, the antibody test is suggested for people who believe they have had the virus in the past, as it looks for the antibodies in the blood [4].
The laboratory diagnosis methods (RT-PCR and antibody test) have two important drawbacks: (1) a low viral load conducts to a low detection rate that can lead to falsenegative results, and (2) the viral tests show positive/negative results but cannot judge the COVID-19 evolution in the chest [5]. In contrast, CT imaging and chest X-ray can be used to detect and measure the severity of the virus. In China, CT is widely used as a first line investigation method in patients with COVID-19 [6] and is recommended as the basis method for COVID-19 diagnosis [7]. However, CT practice implies a high demand for radiology departments and, most importantly, a decontamination of the equipment to reduce the risk of cross-infection, hence reducing the availability and applicability of the method [8].
Chest X-ray is one of the most common diagnosis methods for lung disease due to its accessibility and rapid analysis. Moreover, CXR is not as expensive as CT and does not require a previous preparation of the patient [9]. Therefore, CXR analysis can be applied to help medical professionals diagnose COVID-19 in patients. However, imaging diagnosis does come with its own complications, such as the difficulty of accurately distinguishing COVID-19 pneumonia from other forms of pneumonias caused by the cytomegalovirus, adenovirus, influenza A virus, influenza B virus, MERS, and other viral and bacterial pneumonias [2]. Consequently, this can lead to a COVID-19 diagnosis delay.
According to the Radiological Society of North America, there are some characteristic manifestations on the CXR of a patient with Coronavirus [10]. These manifestations include the consolidation in the peripheral and mid to lower zone distribution, and the presence of bilateral patchy, bandlike ground-glass opacity [11]. In Fig. 1, we present three examples of CXR images. Image A shows a healthy patient, image B a person infected with COVID-19, and image C a person with pneumonia [12].
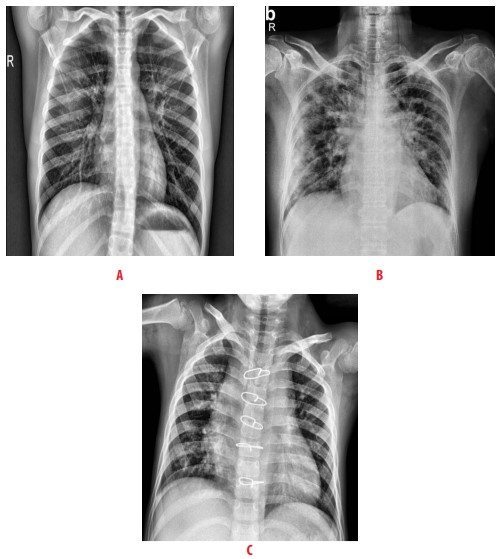
Figure 1
Examples of CXR images taken from [12] A healthy patient, B patient infected with COVID-19, and C patient with pneumonia
Despite the similarities between different types of pneumonia, it is possible to optimize the COVID-19 diagnosis through machine-learning (ML) techniques. Over the years, ML methods have shown reliable results in the analysis of medical images [13]. Deep learning architectures, like convolutional neural networks (CNNs), have especially demonstrated achievement in state-of-the-art performance in medical image classification [14, 15] and segmentation [16, 17, 18] tasks.. As Gu et al. mentions, automated methods for medical diagnosis can play an important role for future diagnostic procedures, especially with the exploration of new CNN architectures that can improve the algorithm performance [19]. In the COVID-19 context, CNNs can recognize visual patterns from CXR images of COVID-19 patients and aid in the diagnosis, providing a rapid response and relieving the demand for radiology experts.
CNNs have obtained remarkable success by automatically optimizing its millions of parameters using labeled training data. Nevertheless, one of the biggest challenges is that such large-capacity trainers are prone to overfitting the training dataset if a small dataset is provided. This is the case of most medical imaging problems, where acquiring labelled data is very expensive and time-consuming and requires the participation of an expert radiologist. Furthermore, given the recent COVID-19 outbreak, obtaining sufficient images can be impossible. Data augmentation is a popular technique that has been presented to extend a dataset artificially. While different data augmentation strategies have been researched and applied in medical image classification [20], there has been little work on which operations work well in COVID-19 recognition, which is a pivotal step in obtaining an effective and discriminative deep learning model.
In this paper, we apply a residual neural network (ResNet) [21] for COVID-19 automated diagnosis. The implemented ResNet can classify a patient's chest-Xray image (CXR) as COVID-19 positive, pneumonia caused from another virus or bacteria, or healthy. Furthermore, to increase the accuracy of the model and overcome the data scarcity of COVID-19 images, a personalized data augmentation strategy is used to enrich the dataset during the training process. Specifically, a three-step Bayesian hyperparameter optimization approach is applied to optimize nine hyperparameters that define the magnitude of the data augmentation operations and the model. Furthermore, we provide insight into which data augmentation operations are successful in increasing a CNN performance when doing medical image classification with COVID-19 CXR. In conclusion, the contributions of our work are as follows:
-
We present the COVID-19 ResNet and its corresponding data augmentation strategy that achieves a competitive classification accuracy for COVID-19 detection.
-
We provide an analysis of which data augmentation operations favor the classification accuracy in medical image classification, which will help researchers determine which operations to apply in their own models and specific problems.
LITERATURE REVIEW
Medical imaging over the years has been essential for the visual representation of tissues and organs. Many imagining formats have been created such as Magnetic Resonance Imaging (MRI), X-ray, Computed Tomography (CT), and others [22]. The evaluation of a medical image is usually a manual and costly process, taking considerable time for a radiologist or medical expert to inspect all the slices and imaging modalities. A successful approach to shorten the inspection and evaluation time is to develop automatic models that extract the most important features from the images [23].
The first COVID-19 case appeared in December 2019, and until now the virus still presents a significant challenge to many countries in the world. To facilitate the diagnosis of COVID-19, researchers have focused on developing machine learning and deep learning methods that accelerate the detection of the virus in a patient's medical images. This is especially necessary since identifying the presence of the virus can help reduce the transmission to uninfected individuals.
Various methods have been presented to automatically identify the disease using chest X-ray images, CNNs being the most used because of its high accuracy and precision. Wang et al. proposed a two-part classification method by applying a pre-trained inception network to convert the image data into one-dimensional feature vectors, followed by a fully connected network to produce the classification prediction. The study reports an accuracy of 79.3% on an external testing dataset [24]. In another study, Sethy et al. uses a two-step method to classify X-ray images. First, they apply a deep learning architecture in the first layers to extract deep features from the image, and then they implement a support vector machine in the last layer to perform the classification. Using a ResNet50 as the deep learning architecture, they report an accuracy of 95.38% on a public dataset [25]. Xin et al. proposed an evolutionary multi-objective neural architecture search method, also known as EMARS-A, to automatically find the architecture of a CNN for COVID-19 classification. Their network achieves an accuracy of 89.67% [26]. On the other hand, Narin et al. developed a model that used five pre-trained convolutional neural networks based on the ResNet and Inception models and tested them in three different binary datasets. An accuracy of 96.1% is obtained in dataset 1, 99.5% in dataset 2, and 99.7% in dataset 3 [27].
METHODOLOGY
In this paper, we employ a convolutional neural network to distinguish CXR images from patients with COVID-19, patients with pneumonia caused by other infections, and healthy individuals. A Residual Convolutional Neural Network (ResNet) [21] is selected because of its capability to extract high level and complex features, which is necessary for the complicated task of medical image recognition. Moreover, to improve the classification accuracy and sensitivity of the model, the technique of data augmentation is extensively applied during training to increase the number of training samples, reduce overfitting, and increase the generalization capability of the model. To take the most advantage of the data augmentation method, the magnitude of the augmentation operations is selected using a Bayesian hyperparameter optimization approach. In the following subsections we present the residual neural network applied, describe the data augmentation method, and conclude by presenting the Bayesian hyperparameter optimization approach used.
Residual neural network
Neural network depth has a strong influence on the accuracy of a network. As a network becomes deeper, it is more capable of recognizing and modelling the complex intricacies of the images. However, when deep networks are being trained, it is difficult to propagate gradients especially to the deeper layers, giving rise to the gradient degradation problem. Gradient degradation causes information loss and reduces the accuracy of the model [21]. The residual network (ResNet) is a very deep network that implements a residual function to counteract the degradation problem. The residual function, also known as residual connection, is implemented through a summation function as shown in equation 1:
 (1)
(1)where the network layers are represented by f(x), and is the input feature map to the first layer. The residual connection adds a connection between the input to the layer and the output of the stacked layers, thus allowing the information to flow directly between network layers during the forward propagation and, most importantly, permitting the gradients to pass during backpropagation. In Fig. 2, the basic residual block implemented in the COVID-19 ResNet classification architecture is presented.
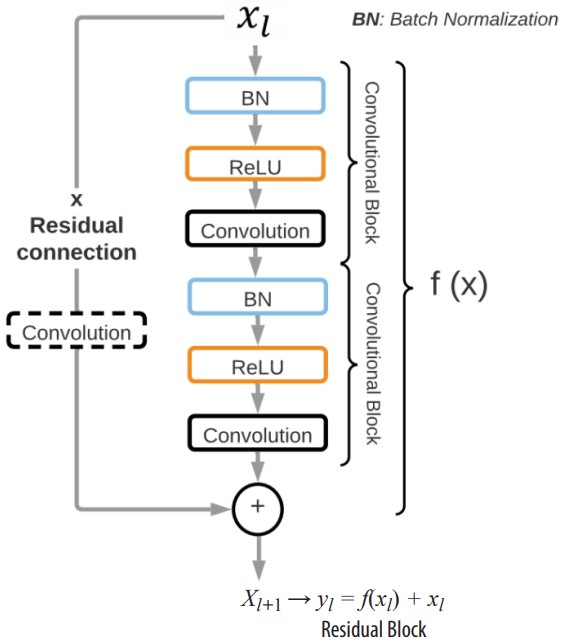
Figure 2
Basic residual block for the COVID-19 ResNet architecture. Each residual block has a residual connection that adds the input image/input feature of layer to the output of the two convolutional blocks producing the new input feature for layer.
The residual block, denoted as yl , is composed of two convolutional blocks that represent f (xi). Each convolutional block is comprised of a batch normalization layer (BN), a ReLU activation function, and a convolutional layer. A ReLU activation function is implemented because it has shown to solve the vanishing gradient problem. Moreover, a BN is also included to reduce the internal covariance shift and to normalize the output of each layer. The size of the convolutional kernels is a hyperparameter that is optimized with the three-step Bayesian Optimization. The input feature to layer forms a residual connection with the transformed input f (xl) through a summation operation, forming the input xl+1 to layer l + 1 (xl+1 = yl = f (xl) + xl). Moreover, in residual blocks where the output features have a different size than the input features of the following residual block, an extra convolutional layer is included before the residual connection. Hence, depending on the location of the residual block in the network, it might have two or three convolutional layers to guarantee the correct flow of information.
The entire ResNet architecture implemented is presented in Fig. 3. The input to the network is a 2D CXR image with shape 2242241. Thirty-two convolutional layers divided into 14 residuals blocks make up the body of the network. The number of filters in the residual blocks increases progressively from 64 to 512. In detail, the ResNet structure has two residual blocks with 64 filters, 10 residual blocks with 128 filters, 10 residual blocks with 256 filters, and 2 residual blocks with 512 filters. On the other hand, as the number of filters is increased, the size of the feature maps is reduced by half. Fig. 3 presents the residual blocks grouped according to their number of filters and dimensions. In the last layers, the ResNet applies an average pooling followed by a flattened layer to compress the features maps into a vector of size 25,088. Finally, a fully connected layer with 3 neurons and a softmax classifier is used to predict the probabilities of an image being part of each of the three classes (COVID-19 positive, pneumonia caused by other bacteria or virus, and healthy). Our network has a total of 15,676,549 trainable parameters which are optimized using the stochastic gradient descent method.
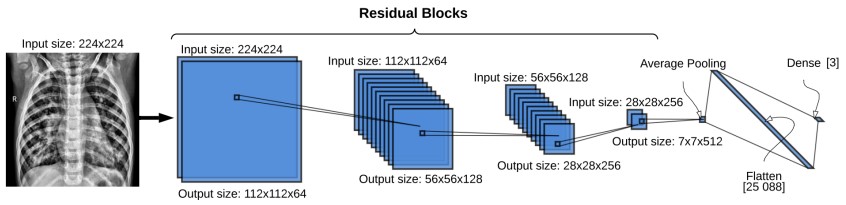
Figure 3
The COVID-19 ResNet architecture. Each blue square represents a residual block. The size of the input to the residual block is located on top of the residual blocks, and the output size on the bottom. Each residual block contains two convolutional blocks with a batch normalization layer, ReLU activation function and a convolutional layer.
Data augmentation
Neural network models can be quite successful when a huge amount of data is available. Nevertheless, in the medical field, acquiring data is costly and sometimes unavailable, prohibiting the quantity of images obtained. Hence, CNNs tend to overfit the training dataset due to the considerable amount of model parameters that need to be fitted. This issue is aggravated by the fact that the COVID-19 outbreak is recent, so the number of publicly available images are limited.
Data augmentation is a method that increases the diversity of the training set by extending it artificially through the application of affine and elastic random transformation to the original images. The most common data augmentation operations are image rotation, reflection, horizontal and vertical shifting, color adjustments, and scaling. In this work, the data augmentation operations tested for training the COVID-19 ResNet are rotation, scaling, width shift, height shift, vertical flip, and horizontal flip because they have shown to increase the accuracy of neural networks. A description of the tested data augmentations is presented next, and an example of these transformations in a CXR image is shown in Fig. 4.

Figure 4
Data augmentation operations applied to a CXR image in the training dataset
Rotation is an affine transformation that rotates an image I by an angle θ around the
center pixel. It is applied through the matrix 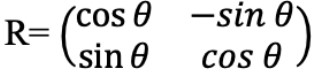
Scaling scales animagel in the horizontal or vertical direction by applying the affine transformation , where sx and sy are the scaling factors in x and y respectively. This operation helps the neural network learn from different shapes and sizes of the region of interest [28].
Width and Height Shift shifts the image I by a given number of pixels on the horizontal or vertical axis. Since the area of interest can be shifted to different regions in the image, it forces the neural network to learn spatially invariant features.
Horizontal and Vertical Flip creates a reflection of the original image I along the horizontal or vertical axis. A flip on the horizontal axis swaps the right and left hemisphere. A vertical flip swaps the up and down section of the image. In natural images, only horizontal flips create real images. However, in medical images vertical flips have also shown to produce realistic images [28].
Bayesian hyperparameter optimization for data augmentation
Determining the data augmentation operations that need to be applied in our specific problem, and to what extent, is a difficult task because of the many possible combinations that can be tested and their effect on the generalization and accuracy of the model. The correct value of these operations could be set manually by considering the values found in other publications [29]. However, data augmentation strategies successfully applied in a dataset may not transfer as effectively to another dataset due to particularities of each dataset and model. Hence, the data augmentation operations explained in section 3.2 (rotation, scaling, width shift, height shift, vertical flip, and horizontal flip) will be treated as hyperparameters in our model and their optimal values selected using a three-step Bayesian hyperparameter optimization approach. The search ranges for these hyperparameters are initially set to the maximum allowable value to try to cover the whole search space.
Furthermore, four more hyperparameters related to the model and training process are added to the hyperparameter search. These hyperparameters are the learning rate, batch size, number of training epochs, and kernel size. Setting the correct learning rate is critical because a rate that is too large will converge very fast to a suboptimal solution, whereas a rate that is too small will halt the training process. There is no rule of thumb for this hyperparameter because it depends on the specific neural network architecture. However, Bengio mentions that a good initial learning rate is less than 1 and greater than 1e-6 [30].
To mitigate overfitting and underfitting, a good number of training epochs must be chosen. The number of epochs depends on the size of the dataset. Given that the dataset used in this work has a limited number of images, the range of the number of training epochs is set from 200 to 300.
Masters et al. recommends mini-batch sizes as small as two or four to improve network accuracy [31]. Considering these recommendations and the computational limitations, the range of the batch size is set between one and three. All the hyperparameters being optimized are shown in Table 1.
In a hyperparameter optimization problem, the objective is to find the hyperparameter values that minimize the validation cross-entropy loss function. Hence, the nine hyperparameters presented represent the decision variables, and their search range corresponds to the search space. A Bayesian optimization approach [32] is applied to solve this problem because it has proven to be effective in solving non-linear and nonconvex optimization, and it reduces the search time through the application ofGaussian Process surrogate function.
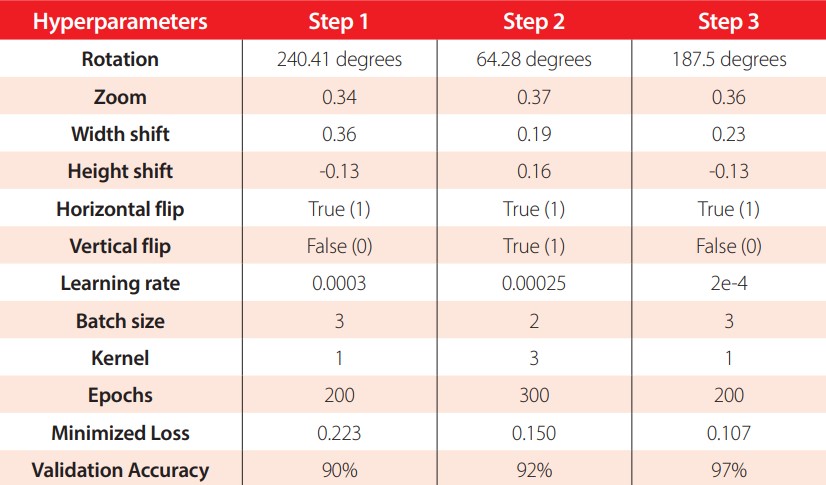
The hyperparameters are optimized applying a three-step optimization process, in which the hyperparameter search bounds are adjusted progressively to reduce the algorithm search space and focus on the most promising search areas. Specifically, in each step we apply the Bayesian optimization approach, with a Gaussian Process surrogate function and an Expected Improvement acquisition function, in the defined search bounds and find the best current solution. In the next step, we redefine the bounds by making them tighter to the previously found solutions. The hyperparameters and their respective search bounds in each step are presented in Table 1. Twenty initial points were collected using a Latin hypercube sampling to approximate the Gaussian Process before running each optimization. The termination criteria for the optimization are 30 iterations or a distance of 1e-8 or less between two consecutive points. The Bayesian optimization process is implemented using the GPyOpt library [33].
| Hyperparameters | Step 1 | Step 2 | Step 3 |
| Rotation | 0 degrees - | 0 degrees - 9 | 68.28 degrees - |
| 359 degrees | 0 degrees | 240.41 degrees | |
| Zoom | -1.0 - 1 | 0.0 - 0.5 | 0.34 - 0.37 |
| Width shift | -1.0 - 1 | 0.0 - 0.5 | 0.19 - 0.35 |
| Height shift | -1.0 - 1 | 0.0 - 0.5 | -0.13 - 0.15 |
| Horizontal flip | True (1) - False (0) | True (1) - False (0) | True (1) - False (0) |
| Vertical flip | True (1) - False (0) | True (1) - False (0) | True (1) - False (0) |
| Learning rate | 3e-4 - 1e-5 | 3e-4 - 1e-5 | 3e-4 - 1e-5 |
| Batch size | 1, 2 and 3 | 1,2 and 3 | 1,2 and 3 |
| Kernel | 1, 3 and 5 | 1,3 and 5 | 1,3 and 5 |
| Epochs | 200-300 | 200-300 | 200-250 |
| Minimized Loss | 0.222 | 0.150 | 0.107 |
Hyperparameters and search bounds optimized in each of the three steps of the Bayesian optimization for the COVID-19 ResNet
Finally, using the Bayesian Optimization approach to obtain the best hyperparameters requires high computational resources. Given our computational limitations, we apply a principal component analysis (PCA) to reduce the dimensionality of the data. One hundred forty principal components per image are selected, which capture 95% of the total variance of the originally 50,176-dimensional image. Therefore, the hyperparameter optimization is performed with the 140-dimensional reconstructed images. Applying the PCA reduction decreases drastically the RAM requirements from 15.51 GB, when the original images are used, to 2.79 GB when the reconstructed images are applied. Despite PCA being an excellent approximator, using the reconstructed images can miss valuable information about the original input. In consequence, we only use these reconstructed images for performing the hyperparameter optimization and apply the full dimensional input for the model training and testing.
EXPERIMENTAL SETUP
Dataset
This study is performed in a publicly available dataset [12] composed of 420 2D CXR images in the Posteroanterior (P.A.) chest views. The images are classified into three categories: COVID-19 patients (140 images), healthy or normal individuals (140 images), and patients with pneumonia caused by bacteria or a virus different from COVID-19 (140 images). The dataset is available in the GitHub repository of the authors https://github.com/abzargar/COVID-Classifier.git
The dataset is split into 70% images for training, 15% images for validation, and 15% images for testing. A simple random sampling method is applied to select the images for each set, making sure that each category is equally presented in each set. The number of images per category and set are presented in Table 2.
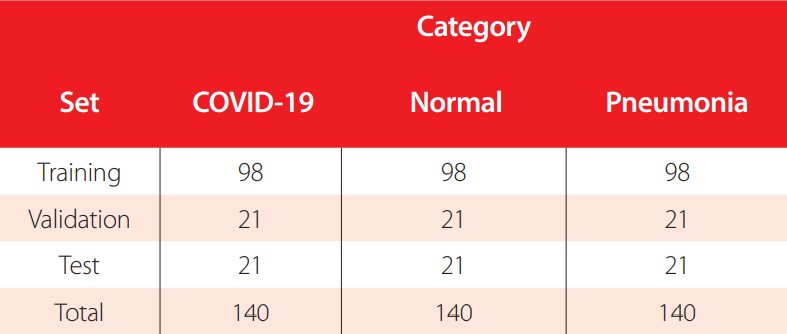
Number of CXR images per category for training, validation, and testing
Preprocessing operations
The main motivation for image preprocessing is to standardize and enhance the image to facilitate the feature extraction. The preprocessing steps applied to the images are gray scale conversion, resizing, and adaptive histogram equalization. An original image and its preprocessed counterpart are shown in Fig. 5. The preprocessing steps are explained next.
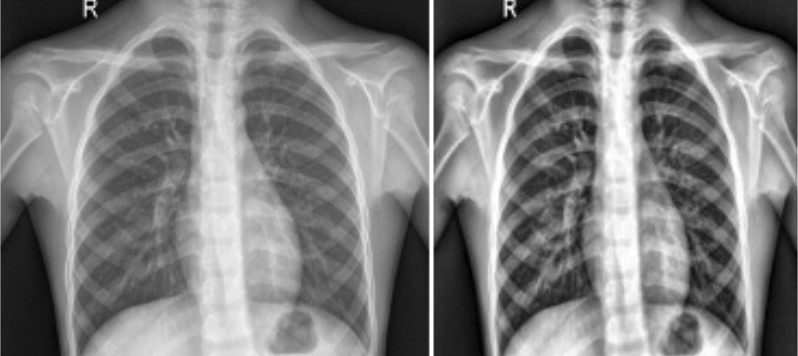
Figure 5
Examples of a preprocessed CXR image A) Non processed Normal CXR, B) Processed Normal 224x224 CXR
Gray scale conversion
Chest Xray-images contain considerable noise, such as blurring, fog, low contrast, and unwanted information. Gray scale conversion is a widely used technique to reduce the noise and computational cost of an image [34, 35]. This conversion transforms the color values of the original images (24 bit) represented in three dimensions XYZ (lightness, chroma and hue) into grayscale images represented only by the luminance (8 bit). The processed grayscale image has pixel values in the range of 0 (black) to 255 (white).
Resizing
The size of the images in the original dataset varies, so to prevent compilation errors during the preprocessing operations and model training, they are resized to a fixed 224x224 pixel size.
Adaptative histogram equalization
Histogram equalization is a contrast enhancement method that applies to each pixel in the image a mapping based on the surrounding pixels. A study made by Sherrier et al. shows that adaptative histogram equalization applied to chest radiography allows certain regions of the CXR to be enhanced differentially [36].
Training
The ResNet is trained with a cross-entropy loss function and the Adam optimizer with the parameters recommended in [37]. The weights are initialized from a gaussian distribution centered on 0 with a standard deviation of , where A, is the number of input units in the weight tensor, and fout the number of output units in the weight tensor. The number of training epochs are selected based on the results of the Bayesian optimization, as well as the data augmentation operations and its values. This information will be presented in the next section.
The code was developed using Google Colaboratory Professional, with a high-RAM hosted runtime with 27.4 gigabytes available and 147.16 gigabytes of available disk space. The programming language used was Python V3.0, and the neural network implemented with the Keras library. The code of our work can be found in a Github repository using the following link: https://github.com/titulacion2021/Image-Classification-ResNet
RESULTS
Bayesian optimization results
The best hyperparameter values found in each step of the optimization process, their respective loss and validation accuracy are presented in Table 3. In the first step, the Bayesian optimization took 15.2 hours to find the best hyperparameters, reached a 0.22 loss, and had a 90% validation accuracy. The second step took 11.19 hours, achieved a 92% validation accuracy, and had a 0.15 loss. In the last step, the optimization converged in 5.4 hours, reached the highest validation accuracy of 97%, and had a loss of 0.10. The hyperparameters found in the third step are the hyperparameter values used to train and test the COVID-19 ResNet.
Best hyperparameter values found in each step of the three-step Bayesian hyperparameter optimization. The best hyperparameters found in step 3 are used to train the COVID-19 ResNet.
Furthermore, to test the adequacy of the three-step Bayesian Optimization, we compare the COVID-19 ResNet against two competing models. First, we train the ResNet architecture using the data augmentation values recommended in the literature [38]. The hyperparameter values tested and the corresponding validation accuracy are presented in Table 4. A 95.0% validation accuracy is reached, which is 2% less than the accuracy obtained using the three-step optimization approach. Considering the need to accurately diagnose COVID-19 in a patient, a 2% increase is an important gain.
| Hyperparameters | Values | |
| Rotation | 45 | |
| Zoom | 0.2 | |
| Width shift | 0.2 | |
| Height shift | 0.2 | |
| Horizontal flip | True (1) | |
| Vertical flip | True (1) | |
| Learning rate | 1e-6 - 1 | |
| Batch size | 2 or 4 | |
| Kernel | 3 | |
| Epochs | 200 | |
| Validation Accuracy | 95% | |
Hyperparameters tested based on literature and the validation accuracy achieved
Secondly, we implement the traditional Bayesian Optimization method to optimize the hyperparameters with the wide ranges set up in step 1 of Table 3 and let it run for 90 iterations, which is the total number of iterations run in the three-step Bayesian optimization method presented. The best hyperparameters found with the traditional Bayesian optimization and the validation accuracy achieved are shown in Table 5. A 95.2% validation accuracy is attained, which shows that the proposed three-step method improves by approximately 2% validation accuracy. Furthermore, the three- step Bayesian optimization method is especially applicable when there is a time limit on the use of the computational resources, as each step takes less time running than the traditional Bayesian Optimization for one long iteration.
| Hyperparameters | Values |
| Rotation | 6 |
| Zoom | 0.5 |
| Width shift | 0.02 |
| Height shift | 0.05 |
| Horizontal flip | True (1) |
| Vertical flip | False(0) |
| Learning rate | 3e-4 |
| Batch size | 2 |
| Kernel | 5 |
| Epochs | 300 |
| Validation Accuracy | 95.2% |
Hyperparameters found with the traditional Bayesian Optimization and validation accuracy achieved
Classification results
In this subsection we present the classification results obtained by the best ResNet (the ResNet trained with the optimal hyperparameter values obtained in 4.4.1) in the test set. The metrics used for the evaluation are the accuracy, precision, recall, and F1-score. The metrics are defined in equations 2-5.
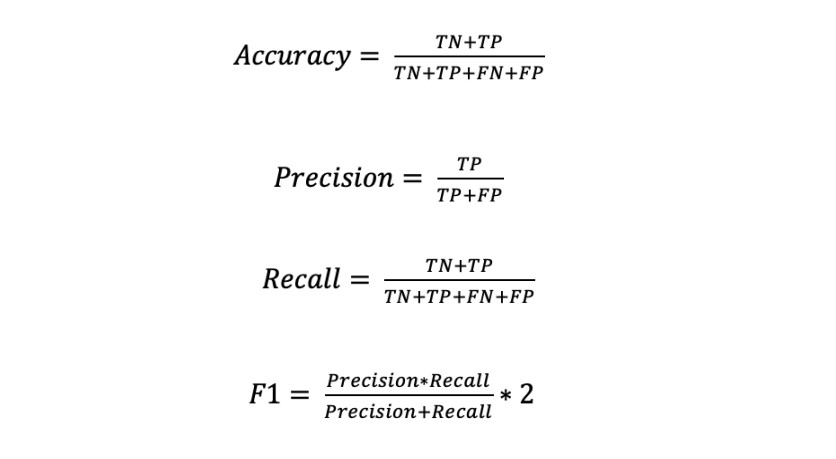
The evaluation metrics in the test set are presented in Table 6. The accuracy reached by the model is 94%, with 59 correctly classified samples out of 63. In terms of the precision, the model correctly detects the positive COVID-19 and pneumonia cases with a high 95%. Meanwhile, the normal cases have a lower positive detection of 91%. Analyzing the recall, in the normal class 100% recall is obtained, while for the COVID-19 class 95%, and for the pneumonia class 86%. Recall aims to minimize the false negatives, hence having a 100% recall in the normal class means the model perfectly distinguishes patients with pneumonia caused by COVID-19 or another virus and bacteria from healthy individuals. Finally, the F1-score provides a harmonic mean between the precision and recall. All classes have an F1-score greater than or equal to 90%, which means that the model provides an adequate balance between precision and recall.
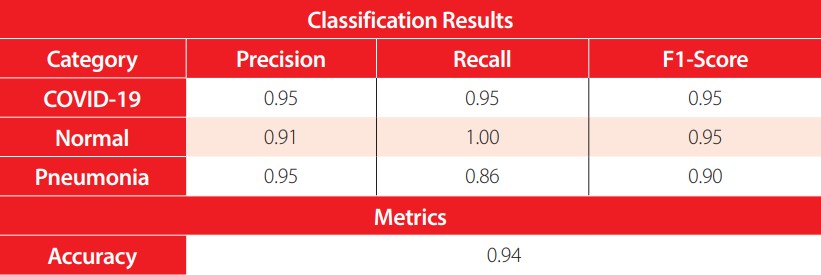
Classification results for each category with the COVID-19 ResNet in the test set
Benchmark comparison
To compare the performance of our network, in Table 7 we present the results of our work and highly cited studies that perform COVID-19 image classification. Furthermore, to provide a better background of each study, the preprocessing techniques and architecture implemented by each work are included. As can be seen, the ResNet is a popular architecture, but what distinguishes ours is the application of the Bayesian optimization to find the best data augmentation and model hyperparameters. The accuracy of the proposed COVID-19 ResNet has a competitive accuracy, being ranked third against the other works. It is also ranked second in terms of sensibility.
| Model | Architecture | Preprocessing | Accuracy (%) | Recall (%) | F1-score (%) |
| Maghdid et al. [39] | AlexNet | Cropping, resizing | 98 | - | - |
| Farooq et al. [40] | ResNet50 | Rescaling, data augmentation, normalizing | 96.23 | 100 | 100 |
| COVID-19 ResNet (Ours)* | ResNet | Data augmentation, normalizing, RGB, color adaptative, reduce dimension | 94 | 95 | 95 |
| Wang et al. [41] | COVID-Net | Rescaling, data augmentation | 93.3 | 91 | - |
| Wu et al. [42] | ResNet50 | Segmentation, Rescaling, Multiview Fusion | 76 | 81.1 | - |
Evaluation metrics of the implemented COVID-19 ResNet (*) and competing state-of-the-art models on COVID-19 image classification. A dash means the authors have not computed the metric.
DISCUSSION AND CONCLUSIONS
The aim of this work was to develop a CNN to automatically classify CXR images into COVID-19 positive, pneumonia caused by a bacteria or a virus other than COVID-19, or healthy. A ResNet architecture was implemented due to its capability to extract complex short- and long-range features, while preventing the gradient degradation problem. The network was trained in a publicly available dataset composed of 420 2D chest X-rays. To overcome the challenges of working with a small dataset, a data augmentation technique was applied. Six data augmentation operations where tested, namely rotation, scaling, width shift, height shift, horizontal flip, and vertical flip. Furthermore, the learning rate, kernel size and batch size of the model were also optimized for this problem. The best values for these nine hyperparameters were selected using a three- step Bayesian optimization approach.
In each step of the three-step optimization process, the Bayesian hyperparameter optimization algorithm minimized the validation cross-entropy loss while searching for the best hyperparameter values. In the initial step, the search bound for the hyperparameters was set to the maximum range allowed by the operation. In next steps, the bound was progressively adjusted around the best solutions found so far to reduce the feasible space and exploit the search region. The strategy showed to provide good results, as the best solutions found in each step kept increasing the validation accuracy and reducing the cross-entropy loss function. Moreover, while the ResNet with the recommended hyperparameter values found in the literature reached a 95% validation accuracy, the ResNet with the optimized hyperparameters obtained a 97% validation accuracy. Hence, this three-step optimization process improved the validation accuracy by 2 percentage points, which is an important gain considering the need to accurately diagnose a COVID-19 positive patient to reduce transmission to uninfected individuals.
In reference to the data augmentation operations, the results obtained through the Bayesian optimization showed that using a vertical flip does not help increase the classification accuracy. This is an interesting finding, since vertical flips have shown to be useful in other types of medical image classification problems and used as default operation when training the networks. Horizontal flips, on the other hand, helped to increase accuracy and are highly recommended to be applied in COVID-19 recognition tasks. In reference to the rotation operation, it showed to be a successful technique, but the angle of rotation should not go beyond 190 degrees as the accuracy starts to decrease. Scaling was also found to be a beneficial operation when a maximum of 37% zoom was applied. In general, scaling over 40% can cause some of the regions of interest to be missed, hence reducing the recognition capability of the model.
Finally, the height and width shift did seem to help increase the accuracy but in small values. In general, all data augmentation operations should be included during training, with exception to the vertical flip, but the magnitude of the operation should be set to medium values (as shown in Table 2). If extreme values are used in data augmentation, the artificially produced images do not adhere to reality and affect the training process of the network. Hence, the validation accuracy decreases instead of increasing. In conclusion, the values obtained in this work for the data augmentation operations may be highly applicable for other research focused on CXR chest classification where only a limited dataset is available.
CONTRIBUTION OF THE AUTHORS
Javier Sebastián Balseca Zurita and Martin Alejandro Cruz Patiño did the data preprocessing, designed the model, performed the experiments and wrote the manuscript. María Gabriela Baldeón Calisto conceived the research idea, supervised the work and results, wrote and revised the manuscript.
CONFLICTS OF INTERESTS
We wish to confirm that there are no known conflicts of interest associated with this publication and there has been no significant financial support for this work that could have influenced its outcome.
We confirm that the manuscript has been read and approved by all named authors and that there are no other persons who satisfied the criteria for authorship but are not listed. We further confirm that the order of authors listed in the manuscript has been approved by all of us.
References
World Health Organization. (2020). Retrieved February 20, 2021, from https://www.who.int/emergencies/diseases/novel-coronavirus-2019/question-and-answers-hub/q-a-detail/coronavirus-disease-covid-19#:~:text=symptoms
Corman, V., Landt, O., Kaiser, M., Molenkamp, R. M., Chu, D., & Drosten, C. (2020). Detection of 2019 novel coronavirus (2019-nCoV) by real-time RT-PCR. Eurosurveillance, 25(3), 2000045.
Center of Disease ,Control and Prevention. (2021). Retrieved February 19, 2021, from https://www.cdc.gov/coronavirus/2019-ncov/testing/diagnostic-testing.html
Center of Disease, Control and Prevention. (2021, February 2). Retrieved February 20, 2021, from https://www.cdc.gov/coronavirus/2019-ncov/testing/serology-overview.html
Dai, W.-c., Zhang, H.-w., Yu, J., Xu, H.-j., Chen, H., Luo, S.P., Zhang, H., Liang, L.H.,Wu, X.L.,Lie, Y., & Lin, F. (2020). CT Imaging and Differential Diagnosis of Covid-19. Canadian Association of Radiologists Journal, 71(2), 195-200.
Wong, H., Lam, H., Fong, A., leung, S., Chin, T., & Lo, C. (2020). Frequency and distribution of chest radiographic findings in patients positive for COVID-19. Radiology, 296(2), E72-E78.
Wan, Y., Shang, J., Graham, R., Baric, R., & Li, F. (2020). Receptor recognition by novel coronavirus from Wuhan: An analysis based on decadelong structural studies of Sars. Journal of Virology, 94(7).
Radiology, A. C. (s.f.). Recomendations for the use of the Chest Radiography and Computed Tomography (CT) for suspected COVID-19 Infection. Retrieved February 21, 2021, from https://www.acr.org/Advocacy-and-Economics/ACR-Position-Statements/Recommendations-for-Chest-Radiography-and-CT-for-Suspected-COVID19
Lujan-Garcia, J. E., Moreno-Ibarra, M. A., Villuendas-Rey, Y., & Yanez-Marquez, C. (2020). Fast COVID-19 and pneumonia classification using chest X-ray images. Mathematics, 8(9), 1423
RSNA. (2020, April 15). Retrieved February 20, 2021, from https://pubs.rsna.org/doi/10.1148/radiol.2020201393?_ga=2.72325459.1392118184.1617117795-543966827.1617117790
Smith, D., Grenier, J., Batter, C., & Spieler, B. (2020). A Characteristic Chest Radiographic Patter in the Setting of the COVID-19. Radiology: Cardiothoracic Imaging, 2(5), e200280.
Khuzani, A. Z., Heidari, M., & Shariati, S. A. (2020, May 8). COVID-Classifier: An automated machine learning model to assist in the diagnosis of COVID-19 infection in chest x-ray images. medRxiv. Retrieved March 6, 2021, from https://github.com/abzargar/COVID-Classifier/tree/master/dataset/original_images_preprocessed
Dai, W. C., Zhang, H. W., Yu, J., Xu, H. J., Chen, H., Luo, S. P., & Lin, F. (2020). CT Imaging and Differential Diagnosis of COVID-19. Canadian Association of Radiologist Journal, 2(71), 195-200.
Parvathy, V. S., Pothiraj, S., & Sampson, J. (2020). Optimal Deep Neural Network model based multimodality fused medical image classification. Physical Communication, 41.
Godasu, R., Zeng, D., & Sutrave, K. (2020). Transfer learning in medical image classification: Challenges and opportunities. Transfer, 5, 28-2020.
Baldeon-Calisto, M., & Lai-Yuen, S. K. (2020). AdaResU-Net: Multiobjective adaptive convolutional neural network for medical image segmentation. Neurocomputing, 392, 325-340.
Baldeon Calisto, M., & Lai-Yuen, S. K. (2020). AdaEn-Net: An ensemble of adaptive 2D-3D Fully Convolutional Networks for medical image segmentation. Neural Networks , 126, 76-94.
Baldeon Calisto, M., & Lai-Yuen, S. (2021). EMONAS-Net: efficient multiobjective neural architecture search framework for 3D medical image segmentation. Artificial Intelligence in Medicine, 102154.
Gu, J., Wang, Z., Kuen, J., Ma, L., Shahroudy, A., Shuai, B., & Chen, T. (2018). Recent avances in convolutional neural networks. Pattern Recognizition, 77, 354-377.
Hussain, Z., Gimenez, F., Yi, D., & Rubin, D. (2017). Differential data augmentation techniques for medical imaging classification tasks. AMIA Annual Symposium Proceedings.
He, K., Zhang, X., Ren, S., & Sun, J. (2016). Deep residual learning for image recognition. Proceedings of the IEEE conference on computer vision and pattern recognition.
Aggarwal, P., Vig, R., Bhadhoria, S., & Dethe, C. (2011). Role of segmentation in medical imaging. International Journal of Computer Applications, 975(8887), 54-61.
Müller, D., & Kramer, F. (2021). MIScnn: a framework for medical image segmentation with convolutional neural networks and deep learing. BMC medical imaging, 1-2.
Wang, S., Kang, B., Ma, J., Zeng, X., Xiao, M., Guo, J., Cai, M., Yang, J., Yaodong, L,. Xu, B., & Meng, X. (2021). A deep learning algorithm using CT images to screen for Corona Virus Disease (COVID-19). European Radiology, 1-9.
Sethy, P. K., Behera, S. K., Ratha, P. K., & Biswas, P. (2020). Detection of coronavirus disease (covid-19) Based on Deep Features. PrePrints.
He, X., Shihao, W., Guohao, Y., Jiyong, Z., & Chu, X. (2020). Efficient Multi-objective Evolutionary 3D Neural Architecture Search for COVID-19 Detection with Chest CT Scans. arXiv preprint arXiv:2101.10667, 1-2.
Narin, A., Kaya, C., & Pamuk, Z. (2020). Automatic Detection of Coronavirus Disease (COVID-19) Using X-ray Images and Deep Convolutional Neural Networks. arXiv preprint arXiv:2003.10849, 2-3.
Zeshan, H., Gimenez, F., Yi, D., & Rubin, D. (2018). Differential Data Augmentation Techniques for Medical Imaging Classification Tasks. Annual Symposium. San Francisco.
Bergstra, J., Barnedet, R., Bengio, Y., & Kegl, B. (2011). Algorithms for hyper-parameter optimization. In Advances in Neural Information Processing Systems (NIPS), 2546-2554.
Bengio, Y. (2012). Practical Recommendations for Gradient-Based Training of Deep Architectures. Neural Networks: Tricks of the trade, 437-478.
Masters, D., & Carlo, L. (2018). Revisiting small batch training for deep neural networks. arXiv preprint arXiv:1804.07612}, 2-3.
Snoek, J., Rippel, O., Swersky, K., Kiros, R., Satish, N., Sundaram, N., Mostofa, P., Prabhat, Mr., & Adams, R. (2015). Scalable bayesian optimization using deep neural networks. International conference on machine learning.
The GPyOpt authors. (2016). GPyOpt: A Bayesian Optimization framework in Python. http://github.com/SheffieldML/GPyOpt
Kaur, S., & Kaur, S. (2014). An EfficientApproach for Number Plate Extraction from Vehicles Image under Image Processing Article. Jalandhar: CT Group of Institutions.
Macedo, S., Givanio, M., & Keiner, J. (2015). A comparative study of grayscale conversion techniques applied to SIFT descriptors. Brazil: Universidade Federal de Pernambuco.
Sherrier, R. H., & Jonhson , G. A. (1987). Regionally Adaptative Histogram Equalization of the Chest. IIEE Transaction on Medical Imaging, 6(1), 1-7.
Kingma, D. P., & Ba, J. (2014). Adam: A method for stochastic optimization. arXiv preprint arXiv:1412.6980.
Gu, S., Pednekar, M., & Slater, R. (2019). Improve Image Classification Using Data Augmentation and Neural Networks. SMU Data Science Review, 2, 1.
Maghdid, H., Assad, K., Ghafoor, A., & Khan, M. (2020). Diagnosing covid-19 pneumonia from x-ray and ct images using deep learning and transfer learning algorithms. arXiv, 00038(2004).
Farooq, M., & Hafeez, A. (2020). Covid-resnet: A deep learning framework for screening of covid19 from radiographs. arXiv, 2003(14395).
Wang, L., Lin, Z. Q., & Wong, A. (2020). Covid-net: A tailored deep convolutional neural network design for detection of covid-19 cases from chest x-ray images. Scientific Reports, 10(09871), 1-12.
Wu, X., Hui, H., Niu, M., Li, L., Wang, B., Li, H., & Tian, J. (2020). Deep learning-based multi-view fusion model for screening 2019 novel coronavirus pneumonia: a multicentre study,. European Journal of Radiology, 128, 109041.