

Biomass Assessment of Peach Trees in the Ecuadorian Andes
Evaluación de biomasa de árboles de durazno cultivados en Los Andes ecuatorianos
ACI Avances en Ciencias e Ingenierías
Universidad San Francisco de Quito, Ecuador
Received: 06 August 2020
Accepted: 15 August 2022
Abstract: This work focused on the evaluation of four essential aspects of biomass based on peach trees grown in the Andean region of Ecuador. In one case, mathematical models have been developed allowing the amount of lignocellulosic material to be quantified from easily measurable parameters such as crown diameter, stem diameter and plant height. Performing quick surveys, these equations led to obtain the amount of biomass contained in a plot. In a second case, elemental analysis of biomass was performed in order to determine the amount of CO2 captured from the atmosphere through photosynthesis during its growth, and thus to assess the contribution of these plots in mitigating climate change. Afterwards, residual biomass from pruning was quantified and a proximal analysis was carried out. This allowed us to assess the suitability of these materials as solid biofuels.The models obtained to determine the volume of the branches gave determination coefficients of 0.98. Models to quantify the biomass of the whole plant had r2 of 70%. The density of the dried material was 0.92 g/cm3, obtaining an average dry wood weight of44.8 kg per plant. This represents a content of 1682 moles of captured CO2 of a developedplant crop (3 years). The average ash on dry wood was 3%, fixed carbon content on drywood was 7%, and volatile content dry wood was 78%. The moisture content of wastematerials after pruning was 45.96%. The drying time in store for humidity below 10%, suitable for burning boiler, was 15 days. The higher heating value of peach wood was18.92MJ/kg.
Keywords: bioenergy, dendrometry, allometric functions, renewable energy.
Resumen: Este trabajo se centró en la evaluación de cuatro aspectos esenciales de la biomasa de árboles de durazno cultivados en la región andina del Ecuador. En un caso, se han desarrollado modelos matemáticos que permiten cuantificar la cantidad de material lignocelulósico a partir de parámetros fácilmente medibles como el diámetro de la copa, el diámetro del tallo y la altura de la planta. Realizando levantamientos rápidos, estas ecuaciones permitieron obtener la cantidad de biomasa contenida en una parcela. En un segundo caso, se realizó un análisis elemental de la biomasa para determinar la cantidad de CO2 capturado de la atmósfera a través de la fotosíntesis durante su crecimiento, y así evaluar la contribución de estas parcelas en la mitigación del cambio climático. Posteriormente se cuantificó la biomasa residual de la poda y se realizó un análisis proximal. Esto nos permitió evaluar la idoneidad de estos materiales como biocombustibles sólidos. Los modelos obtenidos para determinar el volumen de las ramas arrojaron coeficientes de determinación de 0,98. Los modelos para cuantificar la biomasa de toda la planta tenían un r2 del 70 %. La densidad del material seco fue de 0,92 g/cm3, obteniendo un peso promedio de madera seca por planta de 44,8 kg. Esto representa un contenido de 1682 moles de CO2 capturado de un cultivo vegetal desarrollado (3 años). La ceniza promedio en la madera seca fue del 3 %, el contenido de carbono fijo en la madera seca fue del 7 % y el contenido de volátiles en la madera seca fue del 78 %. El contenido de humedad delos materiales de desecho después de la poda fue del 45,96 %. El tiempo de secado en almacenamiento para humedad inferior al 10 %, apto para caldera de combustión, fue de 15 días. El poder calorífico superior de la madera de durazno fue de 18,92 MJ/kg.
Palabras clave: bioenergía, dendrometría, funciones alométricas, energías renovables.
INTRODUCTION
Recently, several studies have demonstrated the importance of being able to quickly identify the amount of biomass contained in agricultural species and their characteristics (Velázquez and Annevelink, 2009; Velázquez and Fernandez, 2010). The total amount of lignocellulosic biomass is related to parameters such as the residue production and the need of fertilizer inputs or pesticides. The development of simple field methods for the quantification of biomass is a scientific challenge because it allows us not only to obtain indirectly related agronomic parameters, but also to study the relation of remote sensing and the development of extended management models (Velázquez et al., 2011; Estornell et al., 2014). Therefore, it breaks new view in agricultural science.
Traditionally, dendrometric methods for quantification of lignocellulosic biomass of trees have been developed in forestry. However, few studies have been conducted in agricultural, urban or shrub species. Velázquez et al. (2010) developed methods for dendrometric analysis of the biomass of five types of Mediterranean shrubs: Rosmarinus officinalis, Quercus coccifera, Cistus albidus, Ulex parviflorum, Erica multiflora. Callejón et al. (2011) examined the potential of various residues of horticultural crops cultivated in greenhouses. In 2013 Velázquez et al. worked in fruit trees, mainly olive and citrus. The dendrometric equations allow quick biomass surveys in plots of specific areas. From elemental biomass analysis, it allows us to calculate the amount of CO2 captured from the atmosphere through photosynthesis during its growth, and thus to assess the contribution of these plots in mitigating climate change (Cannell, 2003; Joosten et al. 2004). It also allows us to determine the absorption of N in order to optimize fertilization or in order to use this specie as green filter.
The biomass quantification methods are based on the assumption of proportionality between different elements of the natural systems. Natural systems keep a proportionality when balance is established at a steady state (Velazquez et al., 2013). The different varieties of plants, diversity in climate and differentiated types of crop management obligate particularized studies for the different species in each ecosystem. The characteristics of Ecuadorian agricultural production systems, with permanently warm weather, makes peach plants not exhibit winter hibernation as it happens in Europe. The withering should be induced by chemical defoliants in this area, moments in which the pruning is practiced. These circumstances together with widely dispersed ownership structures, small size of farms and small planting area per tree require a specific analysis of this system.
This work was focused on the evaluation of four essential aspects of the biomass based on peach crops grown in the Andean region of Ecuador. In one case, mathematical models have been developed allowing us to quantify the amount of lignocellulosic material of the plant from easily measurable parameters, such as crown diameter, stem diameter and plant height. In a second case, an elemental analysis of biomass has been carried out, which allows determining the amount of CO2 captured from the atmosphere through photosynthesis during the plant growth, and thus to assess the contribution of these plots in mitigating climate change (Joosten et al., 2004). Subsequently, residual biomass from pruning has been quantified, and a proximal analysis has been performed: high heat value, moisture content, percentage of volatile matter, fixed carbon content and ash content. This allowed assessing the suitability of these materials as solid biofuels.
Developing a suitable methodology to calculate volumes and total biomass contained in fruit trees from an adapted dendrometry laid the foundations for the use of this methodology as a tool to manage resources from the orchards, establishing adequate predicting models for assessing other parameter such as incomes in raw materials for the cultivation, fruit production, CO2 sink, and waste materials (residual wood) used for energy or industry. To develop the process of biomass quantification, it was necessary to perform systems of measurement, enabling to determine volumes of the analyzed trees. This is the first step for the implementation of logistics models for the biomass delivery chains, where the input is a network structure in which all relevant parameters should be included (Velazquez and Annevelink, 2009). On the other hand, the methodology applied in this article allows us to relate the actual volume of fruit trees with data from remote sensing, such as LiDAR (Estornell et al., 2015). This is the next step in our investigation (Estornell et al., 2014).
MATERIALS AND METHODS
Study area
These tests were conducted in two areas of the Ecuadorian Andes at the north of the country in the province of Imbabura, in the canton Pimampiro UTM X: 172965, Y: 44442 (WGS 84), at 2400 AMSL, and in the central area, in the province of Tungurahua, canton Cevallos UTM X: -1366901, Y: -78606775 at 2850 AMSL.
These two locations allowed us to test and validate the quantization models obtained. Imbabura is characterized by an average temperature of 14.5 °C and rainfall of 1100 mm/year. Tungurahua is characterized by an average temperature of 12.85 °C and annualrainfall of 650 mm/year.
Dendrometric analysis of branches
Dendrometric analysis was carried out to ease the measure of the volume of the branches. To reach this goal, two approaches were undertaken: first, through the determining form factors, and then by obtaining regression functions.
Form factor is defined by equation (1) as the ratio between the actual volume of the branch and a volume of revolution, with models such as cylinder, paraboloid, cone or neiloid taken as reference (Husch et al., 2003). In principle the morphic coefficient is a parameter characteristic of the species and diameter class. However, for each of the determinations there was a statistical variability, where the average and the dispersion were determined. As observed, the form factor (f) allows determining the volume of any structure by measuring the basal diameter and length.
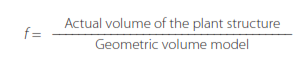 (1)
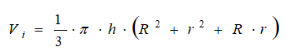
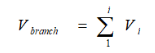
(1)Thirty branches of 60 trees were sampled in each studied area. In each branch, the diameter was measured every 10 cm. The actual volume of each portion of 10 cm length was calculated using equation (2) which is the truncated cone formula. The whole volume was calculated as the sum of each portion between two sections, using equation (3). The calculation model of branch volume was performed by applying formula (4) from the base diameter (d) and length (L) of the branch.
 (2)
(2)
 (3)
(3)
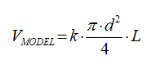 (4)
(4)Where R is the radius of the largest section, r is the radius of the smallest section, Vi is thevolume of a portion of the branch, Vbranch is the actual volume of the branch, VMODEL is thevolume of revolution, k=1 for the cylinder, k=1/2 for the paraboloid, k=1/3 for the cone,k=1/4 for the neiloid, d is the diameter of the base, and L is the length of the branch.
Models to quantify whole wood biomass of the tree
To calculate the volume of wood biomass in the whole plant, two methods were also developed. First, occupation factor was analyzed, and second, regression models were developed for predicting the volume from crown diameter, stem diameter and plant height.
Occupation factor is defined by equation (5) as the ratio between the actual volume of all branches of the peach tree and apparent volume of the crown obtained as a volume of revolution from crown diameter and height from the base to the apex. Semi- ellipse, cylinder, paraboloid and cone were analyzed as models, which contain both the branches as the gaps between them.
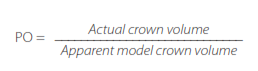 (5)
(5)Measuring the actual volume of all peach plant branches was performed by layers (strata). In each layer the volume of the branches was measured according to the formula obtained in the previous dendrometric analysis.
Pruning residues and collection
Sixty trees were pruned in the different study areas and evaluated. Before pruning the stem diameter, crown diameter and tree height were taken. Subsequently, the trimming was carried out, which was based on removing branches to improve the light into the crown and to induce new sprouting. The branches affected with diseases were also thinned. Pruning and collection times were taken. The weight of cut branches were measured doing bundles and using a dynamometer or scale. Then branches were defoliated to determine the percentage of leaf mass and wood mass. Subsequently, regression models were carried out to relate the amount of residue and collection times from the sizes of the plant.
Characterization of biomass
The characterization of the biomass materials was conducted according to the standards of Table 1.
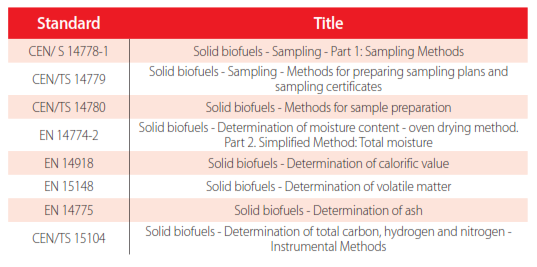
Standards used in the characterization of biomass
RESULTS AND DISCUSSION
Dendrometric analysis of branches
First, a descriptive one-dimensional analysis of parameters measured in the sampled branches is presented in Table 2. This table includes the following statistics: mean, standard deviation, coefficients of skewness and kurtosis. As seen, the values of the coefficients of skewness and kurtosis were within the range (-2 , +2), asserting that the parameters follow a Gaussian distribution.
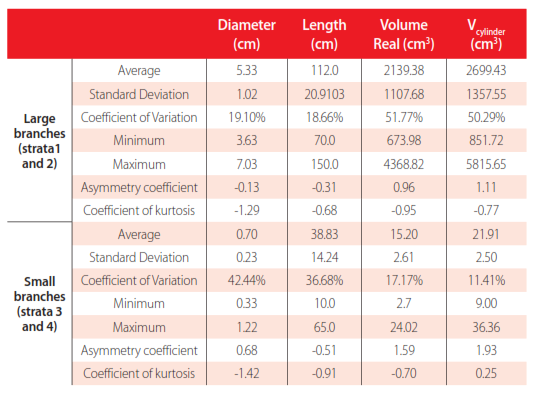
Statistical parameters in the studied branches
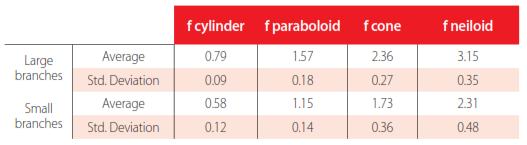
Form factors for each of the geometric models studied
The goal of this section was to define the volume of a branch from its diameter and length, through both form factor and multiple regression equations. In Table 3 form factors obtained for the different models are provided. The model with form factor closer to 1 is the best that represents its shape. In large branches (strata 1 and 2) cylindrical model gave the form factor nearest to 1, with mean of 0.79, standard deviation of 0.09, andcoefficient of variation of 11.39%. These results are acceptable for calculating the actualvolume by equation (6), according to studies carried out in the forest area such as Zianisand Mencuccini (2004) or Jiang et al., (2005), where VR is the branch volume, Db is the basisdiameter, L is the branch length and f is the form factor. In small branches the paraboloidmodel provides a volume that more closely resembles the actual volume of the branch, with a f mean of 1.5 and standard deviation of 0.24. The coefficient of variation was 12.17%.
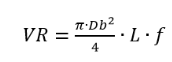 (6)
(6) Four regression models are shown in Table 4: two allow calculating the actual volume ofthe branches, one provides the volume of the whole plant, and the other predicts the weight of the residual biomass from pruning. The explanatory variables had p-values less than 0.05 which give them significance greater than 95%. The coefficients of determination (r2) of the volume of branch equations are high, above 95%. This is the percentage of variability that explains the functions obtained. Moreover, the average error obtained in the application of such equations is 175.05 cm3 in large branches and 1.39 cm3 in small branches, the standard deviations being 58.38 cm3 and 0.52 cm3 respectively. Given that the average of large branches is 2139.38 cm3 and 11 cm3 small, the average error obtained does not exceed 8.20%.
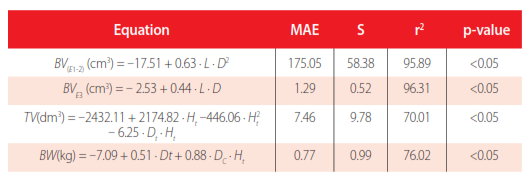
Regression models
Where MAE is the mean absolute error; SD is the standard deviation of the errors; r2 is the coefficient of determination; BV is branch volume (cm3); L is length (cm); D is diameter of the base of the branch (cm); TV is total plant volume (dm3); BW is weight of the pruned branches dry (kg); Dt is diameter of the tree stem (cm); Dc is diameter of tree top (m); and Ht is height of tree (m).Branch volume models used by researchers have similar or minor coefficients ofdetermination, both in forest species (Dhote et al., 2006) and fruit trees (Velázquez et al.,2013). However, few models have been obtained in agricultural trees.
Models quantification in whole plant biomass
The analysis of the distribution of biomass in the crown has been done by strata. The branches that arise from the trunk form the first layer. These branches are called primary branches. The branches that arise from the primary branches constitute the second stratum, called secondary branches. The branches that arise from the secondary branches constitute the third layer and are the tertiary branches, and so on. Table 5 shows the average diameter, average length and average volume of branches that occupy each stratum. The volume occupied by the branches in the different layers was calculated from the application of the previously obtained volume functions.The volume of the branches of each stratum decreased, as expected. In Figure 1, the distribution of biomass within the crown is shown. As can be seen, most of the biomass is found in strata 1, 2 and 3 (over 50%) and subsequently in stratum 4 of the plant wherethe branches are smaller, but in a larger number.
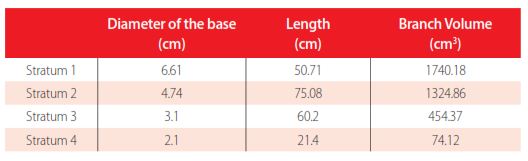
Mean parameters of peach branches in each stratum.
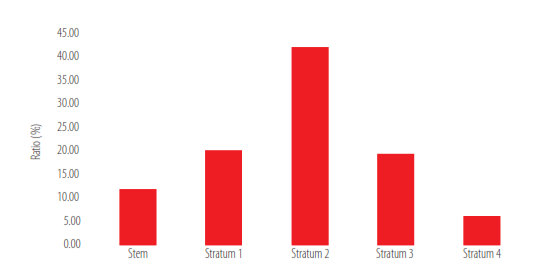
Distribution diagram of the biomass in different strata in the peach crown
A statistical analysis of parameters measured in the trees was carried out. This is shown in Table 6. The average volume of the woody part of the peach tree was 42.17 dm3 and standard deviation 5.8 dm3 (Table 6).
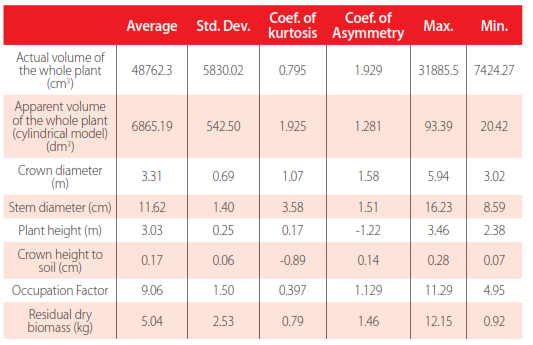
Summary statistics for the studied parameters of the whole plant.
Table 4 shows the prediction equation for the calculation of the volume of the whole plantfrom total height and stem diameter. This finding has great practical value, given that withits application, technicians can calculate the biomass of the whole plot and their respectiverelationships with agronomic and environmental (CO2 fixation) parameters (Brandeis et al.,2006). The determination coefficient obtained is acceptable, 70%. Values in this range arecommon in agricultural predictions where there is a huge influence of uncontrolled factors such as microclimate, nutrient availability, water, and management conditions, which provide a great variability. Mean absolute error obtained in the equation is 7.46 dm3, which we consider acceptable as indicated in Table 6. The average volume is 48.76 dm3 per plant, which represents a relative error of 15%. It is necessary to note that volume equations for common timber species are higher because they only consider stem, and they are notinfluenced by crown pruning (Husch et al., 2003; Jiang et al., 2005; Akindele and LeMay, 2006).
Finally, the mean value and standard deviation of the occupation factor (FO) are 9.06 cm3/dm3 and 1.50 cm3/dm3, respectively. This factor is the ratio of the actual volume of lignocellulosic material of the plant and its apparent volume. The apparent volume is ageometric model, generally cylinder, calculated from crown diameter and height. Thevolume of this theoretical cylinder is formed by the branches and the gaps betweenthem. FO values assume a conversion factor in order to obtain the actual volume fromthe calculation of the cylinder model volume. Similar values were obtained for citrustrees (Velázquez et al., 2012) and olive trees (Velázquez et al., 2014).
Residues from pruning
Correlation coefficients between the measured variables and the residual biomass are shown in Table 7. Correlation coefficients can vary between -1 and +1, measuring the strength of linear relationship between variables. Negative values indicate inverse linear relationships; however, positive values indicate direct linear relationships. As can be seen, the residual biomass from pruning is positively related to the crown diameter,stem diameter and plant height. This means that when the size of the plant increases, the available amount of residual biomass is larger. However, it was found that the relationship between residual biomass and height from the crown to the soil was very low, because the Pearson coefficient is close to 0. It can also be observed that the crown diameter and plant height were positively related to stem diameter. This means that when the stem is larger in the peach tree, the crown diameter and height is also greater. However, plant height was less influenced by the crown diameter because the Pearson coefficient had a relatively low value (0.19).
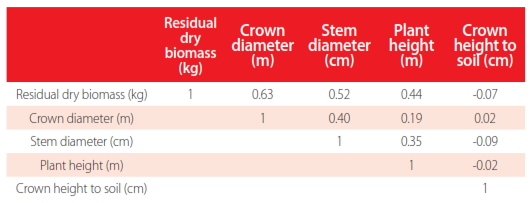
Analysis of the linear relationship between the variables through the Pearson coefficient.
Finally, a regression model to predict residual biomass obtainable from peach tree pruning was calculated from the dimensions of the plant, which is shown in Table 4. Coefficient of determination (r2) was 76%. This was not a very high value because of the high variability and uncontrolled factors. However, the absolute value of the errors of this equation is 0.77 kg and the deviation of the errors obtained by the equation is 0.99 kg. These values are better than results obtained by Velázquez et al. (2013)
It is important to notice that in order to estimate the residual biomass of the plant, two approaches can be applied: average value of the residual biomass shown in Table 6, and the equation BW in Table 4 with R2 = 0.77. Using the average, the available average residual biomass is 5.05 kg dry matter per tree. Assuming a planting area of 4 x 4 m2, this equates to 3.15 tonnes of dry matter per hectare.
Average pruning time per tree was 3.35 min with standard deviation of 0.65 min. Collection time of the pruning residues per tree to do piles next to the tree was 2.36 min with standard deviation of 0.75 min.
Energy characterization
In this section the physical parameters such as moisture content, density, percentage of volatiles, and ash of the lignocellulosic material in peach wood were analyzed. The average data and standard deviations are shown in Table 8. The higher heating value of peach wood is 18.9 MJ/kg. This is within the same range of energy wood (Vargas et al., 2012), but it is higher than in the residues coming from horticultural crops (Callejón et al., 2011). The N content is lower than the limits established by the standard EN 14691-part4 which fixes the conditions for chips used as biofuels (N<1%).
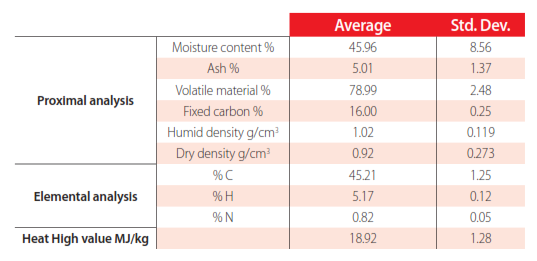
Mean and standard deviation of the physical parameters of lignocellulosic materials of peach trees.
Note that the number of carbon atoms contained in the carbon dioxide molecule is 1. Therefore, the number of moles of CO2 absorbed by the plant through photosynthesis is equal to the number of moles of carbon that exists in its structure. The percentage of carbon contained in the peach wood is 45% (Vargas-Moreno et al., 2012).
On the other hand, by multiplying the plant volume by its density (0.92 g/cm3) the mass is determined. By multiplying the mass of the plant by the percentage of its carbon content, the total carbon mass in the plant is obtained. Since the atomic weight of carbon is 12, dividing the weight of carbon contained in the plant by its atomic weight gives the number of existing carbon moles, equal to the number of moles of carbon dioxide.
Note that the molecular weight of carbon dioxide is 44 q/mol CO2, (12 C + 32 O2). Therefore, it is possible to calculate the grams of CO2 previously absorbed by the plant, fixed in the biomass that will later be released to the atmosphere with its combustion.
Whereas the average volume per plant is 48762 cm3, the number of moles of CO2 fixed by the crop during its growth is 48762 cm3 x 0.92 g cm-3 x 0.45 g C g biomass-1/12 = 1682 moles CO2, which is equivalent to 77.38 kg of CO2 per tree. The high volatile mattercontent suggests that this residue may have good aptitude for direct combustion inboiler or gasification processes.
CONCLUSIONS
In this study the shape and volume of the branches of peach trees were characterized in each stratum. It has been shown that the stem shape and thicker branches of the plant, corresponding to stratum 1, fit well into a cylinder shape, while small branches fit better to a parabolic model.
Methods have been developed to predict roughly the biomass contained in the whole plant. Calculated volume functions have high determination coefficients, so it is considered suitable for practical application in the process of quantification of biomass.
Lignocellulosic plant biomass is distributed unevenly, with stratum 2 containing most of the plant biomass, 42%. Another 40% is distributed among strata 1 and 3, and only 12% of biomass is concentrated in the stem.
From elemental and proximal characterization of waste materials, it can be concluded that ash content is less than 1%, the volatile content is greater than 75%, carbon staining in the wood is around 45%, and the nitrogen content does not exceed 1% by weight. In summary, it can be considered 5.05 kg of dry matter per plant, available for bioenergy feedstocks, which is equivalent to 624 trees per hectare to 3.15 tons per hectare.
ACKNOWLEDGEMENTS
The participation of Dr. Borja Velázquez-Martí in this work was possible by funding from the Ecuadorian Government by means of the PROMETEO program, led by the Secretaría Nacional de Educación Superior, Ciencia y Tecnología (SENESCYT).
This work was carried out within the framework of the inter-university cooperation ECUMASA network focused on the study and characterization of biomass in Ecuador, consisting of four Ecuadorian universities: Universidad Técnica de Ambato, Universidad Estatal de Bolivar, Universidad Técnica del Norte and Universidad Católica Santiago de Guayaquil.
This work has been carried out within the framework of the IBEROMASA Network of the Ibero-American Program on Science and Technology for Development (CYTED).
AUTHOR CONTRIBUTIONS
Conceptualization, B. Velázquez-Martí; methodology, data curation B. Velázquez-Martí and C. Cazco-Logroño; software, J. Vega; validation, J. Vega and C. Cazco-Logroño; formal analysis, B. Velázquez-Martí; investigation, B. Velázquez-Martí and A. Gutiérrez; data curation; writing—original draft preparation, B. Velázquez-Martí and H. R. Chandi. All authors have read and agreed to the published version of the manuscript. Authorship must be limited to those who have contributed substantially to the work reported.
CONFLICTS OF INTEREST
The authors declare no conflict of interest.
REFERENCES
[1] Akindele, S. O., & LeMay, V. M. (2006). Development of tree volume equations for common timber species in the tropical rain forest area of Nigeria. Forest Ecology and Management, 226(1–3), 41-48. https://doi.org/10.1016/j.foreco.2006.01.022
[2] Brandeis, T. J., Delaney, M., Parresol, B. R., & Royer, L. (2006). Development of equations for predicting Puerto Rican subtropical dry forest biomass and volume. Forest Ecology and Management, 233(1), 133-142. https://doi.org/10.1016/j.foreco.2006.06.012
[3] Callejón-Ferre, A. J., Velázquez-Martí, B., Lopez-Martinez, J. A., & Manzano-Agugliaro, F. (2011). Greenhouse crop residues: Energy potential and models for prediction of their higher heating value. Renewable and Sustainable Energy Reviews, 15(2), 948-955. https://doi.org/10.1016/j.rser.2010.11.012
[4] Cannell, M. G. R. (2003). Carbon sequestration and biomass energy offset: Theoretical, potential and achievable capacities globally, in Europe and the UK. Biomass Bioenergy, 24(2), 97-116. https://doi.org/10.1016/S0961-9534(02)00103-4
[5] Dhote, J. F., Le Moguedec, G., Vallet, P., Dhôte, J., Le Moguédec, G., Ravart, M., & Pignard, G. (2006). Development of total aboveground volume equations for seven important forest tree species in France. Forest ecology and management, 229(1–3), 98-110. https://doi.org/10.1016/j.foreco.2006.03.013
[6] EN 14691-part 4. Wood chips - Product standard for non-industrial use.
[7] Estornell, J., Velázquez-Martí, B., López-Cortés, I., Salazar, D., & Fernández-Sarría, A. (2014). Estimation of wood volume and height of olive tree plantations using airborne discrete-return lidar data. GIScience & Remote Sensing, 51(1), 17-29. https://doi.org/10.1080/15481603.2014.883209
[8] Estornell, J., Ruiz, L. A., Velázquez-Martí, B., López-Cortés, I., Salazar, D., & Fernández-Sarría, A. (2015). Estimation of pruning biomass of olive trees using airborne discrete-return LiDAR data. Biomass and Bioenergy, 81, 315-321. https://doi.org/10.1016/j.biombioe.2015.07.015
[9] Husch, B., Beers, T. W., & Kershaw Jr., J. A. (2003). Forest Mensuration, 4th ed. John Wiley and Sons, Inc., New Jersey, USA, p. 443.
[10] Jiang, L., Brooks, J. R., & Wang, J. (2005). Compatible taper and volume equations for yellow-poplar in West Virginia. Forest Ecology and Management, 213(1–3), 399-409. https://doi.org/10.1016/j.foreco.2005.04.006
[11] Joosten, R., Schumacher, J., Wirth, C., & Schulte, A. (2004). Evaluating tree carbon predictions for beech (Fagus sylvatica L) in western Germany. Forest Ecology and Management, 189, 87-96. https://doi.org/10.1016/j.foreco.2003.07.037
[12] Velázquez-Martí, B., & Annevelink, E. (2009). GIS application to define biomass collection points as sources for linear programming of delivery networks. Transactions of ASABE, 52(4), 1069-1078. https://doi.org/10.13031/2013.27776
[13] Velázquez-Martí, B., Fernandez-Gonzalez, E., Estornell, J., & Ruiz, L. A. (2010). Dendrometric and dasometric analysis of the bushy biomass in Mediterranean forests. Forest Ecology and Management, 259(5), 875-882. https://doi.org/10.1016/j.foreco.2009.11.027
[14] Velázquez-Martí, B., & Fernandez-Gonzalez, E. (2010). Mathematical algorithms to locate factories to transform biomass in bioenergy focused on logistic network construction. Renewable Energy, 35(9), 2136-2142. https://doi.org/10.1016/j.renene.2010.02.011
[15] Velázquez-Martí, B., Fernández-González, E., López-Cortes, I., & Salazar-Hernández, D. M. (2011). Quantification of the residual biomass obtained from pruning of trees in Mediterranean almond groves. Renewable Energy, 36(2), 621-626. https://doi.org/10.1016/j.renene.2010.08.008
[16] Velázquez-Martí, B., Estornell, J., López-Cortés, I., & Martí-Gavila, J. (2012). Calculation of biomass volume of citrus trees from an adapted dendrometry. Biosystems Engineering, 112(4), 285-292. https://doi.org/10.1016/j.biosystemseng.2012.04.011
[17] Velázquez-Martí, B., Fernández-Gonzalez, E., López-Cortés, I., & Callejón-Ferre, A. J. (2013). Prediction and evaluation of biomass obtained from citrus trees pruning. Journal of Food, Agriculture & Environment, 11(3&4), 1485-1491.
[18] Velázquez-Martí, B., López-Cortés, I., & Salazar, D. M. (2014). Dendrometric analysis of olive trees for wood biomass quantification in Mediterranean orchards. Agroforestry Systems, 88(5), 755-765. https://doi.org/10.1007/s10457-014-9718-1
[19] Vargas-Moreno, J. M., Callejón-Ferre, A. J., Pérez-Alonso, J., & Velázquez-Martí, B. (2012). A review of the mathematical models for predicting the heating value of biomass materials. Renewable and Sustainable Energy Reviews, 16(5): 3065– 3083. https://doi.org/10.1016/j.rser.2012.02.054
[20] Zianis, D., & Mencuccini, M. (2004). On simplifying allometric analyses of forest biomass. For.Ecol. Manage., 187(2– 3), 311-332. https://doi.org/10.1016/j.foreco.2003.07.007