
Neural network-based analytical model to predict the shear strength of steel girders with a trapezoidal corrugated web
Modelo analítico basado en redes neuronales para predecir la estabilidad a cortante de vigas de acero con un alma corrugada trapezoidal
ACI Avances en Ciencias e Ingenierías
Universidad San Francisco de Quito, Ecuador
Received: 12 March 2019
Accepted: 20 September 2019
Abstract: Corrugated webs are used to increase the shear stability of steel webs of beam-like members and to eliminate the need of transverse stiffeners. Previously developed formulas for predicting the shear strength of trapezoidal corrugated steel webs, along with the corresponding theory, are summarized. An artificial neural network (ANN)-based model is proposed to estimate the shear strength of steel girders with a trapezoidal corrugated web, and under a concentrated load. 210 test results from previous published research were collected into a database according to relevant test specimen parameters in order to feed the simulated ANNs. Seven (geometrical and material) parameters were identified as input variables and the ultimate shear stress at failure was considered the output variable. The proposed ANN-based analytical model yielded maximum and mean relative errors of 0.0% for the 210 points from the database. Moreover, still based on those points, it was illustrated that the ANN-based model clearly outperforms the other existing analytical models, which yield mean errors larger than 13%.
Keywords: Shear strength, corrugated webs, trapezoidal corrugation, steel girders, artificial neural networks, analytical model.
Resumen: Las almas corrugadas son usadas para incrementar la estabilidad a cortante de las almas de las vigas de acero de los elementos en forma de viga para eliminar la necesidad de rigidizadores transversales. Las fórmulas desarrolladas con anterioridad para predecir la resistencia a cortante de las almas de acero corrugado trapezoidales son resumidas junto con la teoría correspondiente. Se propone un modelo basado en una red neuronal artificial (ANN por su siglas en inglés) para estimar la resistencia a cortante de las vigas de acero con una alma corrugada trapezoidal y bajo una carga concentrada. Se recopilaron 210 resultados de pruebas de investigaciones publicadas previamente en una base de datos de acuerdo con los parámetros relevantes de la muestra de prueba para alimentar los modelos ANN simulados. Se identificaron siete parámetros (geométricos y materiales) como variables de entrada y el esfuerzo cortante final en caso de falla se consideró la variable de salida. El modelo analítico basado en ANN propuesto, arrojó errores relativos máximos y medios de 0.0% para los 210 puntos de la base de datos. Además, aún con base en esos puntos, se ilustró que el modelo basado en ANN claramente supera a los otros modelos analíticos existentes, que producen errores medios mayores al 13%.
Palabras clave: Resistencia a cortante, almas corrugadas, corrugado trapezoidal, vigas de acero, red neuronal artificial, modelo analítico.
INTRODUCTION
Corrugated steel plates without additional stiffeners are characterized by high shear buckling strength and out-of-plane flexural stiffness, having been widely used in structural engineering applications, such as large span roofs, steel plate shear walls, and bridge girders [1-4]. The concept of replacing flat webs with corrugated webs in bridge structures was first proposed in France in 1986, then successfully applied worldwide in the past 30 years [5, 6]. Typically, the corrugations in the web are trapezoidal, but forms like sinusoidal, triangular, and rectangular have also been considered. Corrugations are used to increase the shear stability of webs in beam-like members, thus eliminating the need of transverse stiffeners. This paper focuses on the shear strength of steel webs with trapezoidal corrugations, a topic that has been extensively studied since the end of 20th century, covering both buckling and plasticity phenomena [7-13]. Shimada (1965) [14] was the first to study the shear strength of steel girders made of folded-plate webs. Easley and McFarland (1969) [15] proposed the global shear buckling equation of corrugated webs by treating them as flat and orthotropic. Lindner & Aschinger (1988) [16] carried out experimental tests to assess the shear strength of trapezoidal corrugated steel webs and suggested using 70% of the elastic shear buckling stress as the nominal strength for design purposes. Luo & Edlund (1994, 1996) [17, 18] analysed the buckling of trapezoidal corrugated panels under in-plane loading by spline finite strip and finite element (FE) methods. The influence on the elastic buckling load of various parameters, such as geometry, loading patterns and boundary conditions, was assessed. Elgaaly et al. (1996) [19] presented experimental and analytical results for steel beams with trapezoidal corrugated webs loaded predominantly in shear, and proposed bucking formulas based on (i) the local deformation of the corrugation folds modelled as isotropic flat plates, or (ii) the global deformation of the entire web panel modelled as an orthotropic plate. Metwally (1998) [10] investigated the behaviour of steel girders with trapezoidal corrugated webs and proposed a formula for predicting their nominal shear strength. Yamazaki (2001) [20] proposed formulae for the computation of the buckling strength of corrugated webs, based on results from six full-scale models of steel bridge girder webs. Driver et al. (2006) [21] tested full-scale corrugated web girders made of HPS 485W steel, assessed the effect of web initial geometric imperfections through measurements of the out-of-plane displacements, and proposed a lower bound design equation that accounts for both local and global buckling of the web in the elastic and inelastic domains. Watanabe et al. (2007) [22] presented test results for the shear capacity of steel girders using four different trapezoidal corrugation shapes. Yi et al. (2008) [23] studied the nature of the interactive shear buckling of corrugated webs and concluded that the first order interactive shear buckling equation not accounting for material inelasticity provides a good estimation of the shear strength of corrugated steel webs by comparison with 15 tests and finite element analysis (FEA) results. Moon et al. (2009) [24] presented three test results, described the shear strength formula previously presented by Yi et al. (2008) [23], and compared the proposed formula and several other formulas with results from 17 tests. Sause & Braxtan (2011) [25] summarized previously developed formulas for predicting the shear strength of trapezoidal corrugated steel webs, along with the corresponding theory, and proposed a novel formula. Nie et al. (2013) [26] conducted an experimental and analytical study to investigate the shear strength of trapezoidal corrugated steel webs. The experimental program involved testing eight H-shaped steel girders with trapezoidal webs. Hassanein and Kharoob (2013a, b) [27, 28] carried out geometrically and materially nonlinear imperfect analyses (GMNIA) of full-scale bridge girders with corrugated steel webs failing by shear and found that when the ratio of flange’s thickness to corrugated web’s thickness was greater than three, the boundary conditions between flange and web were approximately fixed; a formula for computing the interactive shear buckling of corrugated webs under fixed boundary conditions was proposed. Leblouba et al. (2017a, b) [29, 30] conducted laboratory tests on a series of corrugated steel web beams to investigate their shear behaviors; three typical failure modes were observed and the failure mechanisms on the post-buckling phase were assessed; besides, five analytical models for the estimation of the critical shear buckling stress based on FE analysis results were proposed and validated against test data.
Despite all the research done on the shear behavior of steel members with corrugated webs, design codes or guidelines, with the Eurocode (2005) [31] and JSCE (1998) [32] as exceptions, are still lacking specifications for this type of structural elements [33]. Moreover, there are still many uncertainties and discrepancies associated with test data and proposed models due to many factors, including geometric imperfections of the web, material properties, shear buckling modes, and inconsistencies between the assumed test conditions and the theoretical models. In order to effectively (accurately and efficiently) estimate the shear capacity of corrugated web steel girders, this paper proposes the use of artificial neural networks (also referred in this manuscript as ANN or neural nets), a popular machine learning technique. Machine learning, one of the six disciplines of Artificial Intelligence (AI), without which the task of having machines acting humanly could not be accomplished, allows us to “teach” computers how to perform tasks by providing examples of how they should be done [34]. When there is abundant data (also called examples or patterns) explaining a certain phenomenon, but its theory richness is poor, machine learning can be a perfect tool; as such, its application to the problem of shear in corrugated steel web is suitable and timely. The artificial neural network is the (i) oldest [35] and (ii) most powerful [36] technique of machine learning. ANNs also lead the number of practical applications, virtually covering any field of knowledge [37, 38]. In its most general form, an ANN is a mathematical model designed to perform a particular task, based on the way the human brain processes information, i.e., with the help of its processing units (the neurons). ANNs have been employed to perform several types of real-world basic tasks. Concerning functional approximation, ANN-based solutions are frequently more accurate than those provided by traditional approaches, such as multi-variate nonlinear regression, besides not requiring a good knowledge of the function shape being modelled (Flood, 2008) [39]. The proposed ANN was designed based on 210 experimental results available to date in the literature (see section 2). The focus of this study was not to understand the mechanics underlying the shear behavior of corrugated steel webs, but parametric studies by means of accurate and robust ANN-based models make it possible to evaluate and improve existing mechanical models.
DATA GATHERING
Many shear strength tests of I-shaped beams and girders with trapezoidal corrugated webs have been conducted. The 210-point dataset [40] used to feed the ANN software employed in this work was assembled from the following experimental results [13, 16, 19, 20, 22, 24-26, 29, 30, 41-45].
Seven independent variables were adopted as inputs in ANN simulations, as described and illustrated in Table 1 and Figure 1, respectively. In Figure 1(a), a simply supported girder with corrugated steel web (height hw) is subjected to a concentrated load (Q) distanced a (shear span) from the left support, until (web) shear failure occurs. Figure 1(b) depicts details of the corrugated web mid surface (top-view of a single “wavelength”), namely the widths of parallel and inclined folds (b and c, respectively), the projected width of the inclined fold (d), the corrugation depth (hr), and the thickness of the corrugated plate (tw). The maximum shear stress (assumed uniform over web’s height) when failure occurs (τe) is the target/output (dependent) variable considered in all assessed ANNs. Target values were either reported by the authors of the experimental tests or calculated as τe = Ve/(hwtw), where Veis the maximum shear force carried by the test specimen.
| Input variables | ANN inputs | Values | ||||
| min | max | average | ||||
| a (mm) | shear span | 1 | 287 | 4500 | 990 | |
| hw (mm) | web height | 2 | 260 | 2005 | 744 | |
| tw (mm) | web thickness | 3 | 0.1 | 8 | 1.6 | |
| Geometry | b (mm) | width of the parallel fold | 4 | 19.8 | 300 | 112 |
| d (mm) | projected width of the inclined fold | 5 | 11.9 | 220 | 71.8 | |
| hr (mm) | corrugation depth | 6 | 12 | 150.2 | 66.9 | |
| Material fy (MPa) | steel nominal yield stress | 7 | 171 | 714 | 377.69 | |
| Target variable | ANN output | Values | ||||
| min | max | average | ||||
| Strength τe (MPa) | ultimate shear stress | 1 | 19.0 | 375.9 | 160.1 | |
Variables (and some stats on their values) considered for ANN simulations.
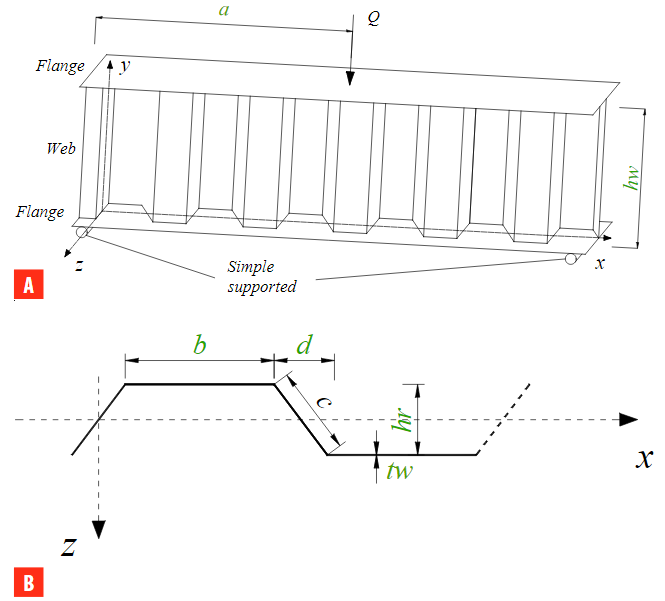
(A) Simple supported corrugated web steel girder under concentrated load, and (B) mid surface profile of a single“wavelength”of the trapezoidal corrugated web.
ARTIFICIAL NEURAL NETWORKS
Brief Introduction
Since artificial neural networks (ANN) are a machine learning technique widely described in the scientific literature, please refer to Ref. [46] for a more thorough presentation of this topic. The general ANN structure consists of several nodes disposed in L vertical layers (input layer, hidden layers, and output layer) and connected between them, as depicted in Figure 2. Associated to each node in layers 2 to L, also called neuron, is a linear or nonlinear transfer function, which receives the so-called net input and transmits an output. In this work, only feedforward networks were implemented, i.e., output from any node is only transmitted to nodes located in subsequent layers (as shown in Figure 2). ANN’s computing power makes them suitable to efficiently solve small to large-scale complex problems, which can be attributed to their (i) massively parallel distributed structure and (ii) ability to learn and generalize, i.e., produce reasonably accurate outputs for inputs not used during the learning (also called training) phase.
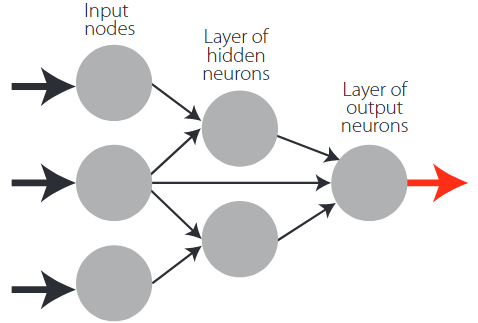
Example of a feedforward network with node structure 3-2-1.
Learning
Learning is nothing else than determining network unknown parameters through some algorithm in order to minimize network’s performance measure, typically a function of the difference between predicted and target (desired) out puts. When ANN learning is iterative in nature, it consists of three phases: (i) training, (ii) validation, and (iii) testing. From previous knowledge, examples or data points are selected to train the network, grouped in the so-called training dataset. During an iterative learning, while the training dataset is used to tune network unknowns, a process of cross-validation takes place by using a set of data completely distinct from the training counterpart (the validation dataset), so that the generalization performance of the network can be attested. Once “optimum” network parameters are determined, typically associated to a minimum of the validation performance curve (called early stop – see Figure 3), many authors still perform a final assessment of model’s accuracy by presenting to it a third fully distinct dataset called “testing.” Heuristics suggest that early stopping avoids overfitting, i.e. the loss of ANN’s generalization ability.
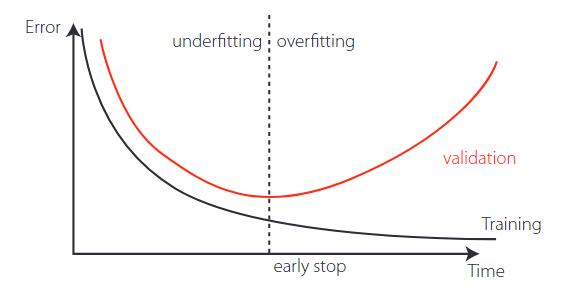
Assessing ANN’s generalization ability via cross-validation.
Implemented ANN features
The “behavior” of any ANN depends on many“features,” having been implemented 15 ANN features in this work (including data pre/post processing ones). For those features, it is important to bear in mind that no ANN guarantees good approximations via extrapolation (either in functional approximation or classification problems), i.e., the implemented ANNs should not be applied outside the input variable ranges used for network training. Since there are no objective rules dictating which method per feature guarantees the best network performance for a specific problem, an extensive parametric analysis (composed of nine parametric sub-analyses) was carried out to find “the optimum” net design. A description of all methods/formulations implemented for each ANN feature (see Tables 2-4)—they are a selection from state of art literature on ANNs, including both traditional and promising modern techniques, and can be found in previous published works [47]—may need to be reviewed by the reader to fully understand the meaning of all variables reported in this manuscript. The whole work was coded in MATLAB [48], making use of its neural network toolbox when dealing with popular learning algorithms (1-3 in Table 4). Each parametric sub-analysis (SA) consists of running all feasible combinations (also called “combos”) of pre-selected methods for each ANN feature, in order to get performance results for each designed net, thus allowing the selection of the best ANN according to a certain criterion. The best network in each parametric SA is the one exhibiting the smallest average relative error (called performance) for all learning data.
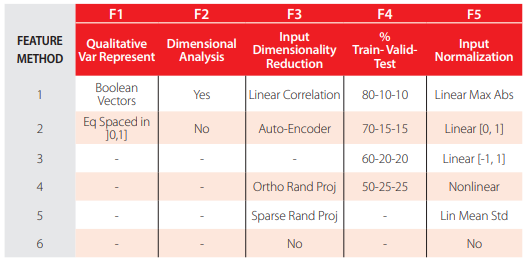
Implemented ANN features (F) 1-5.
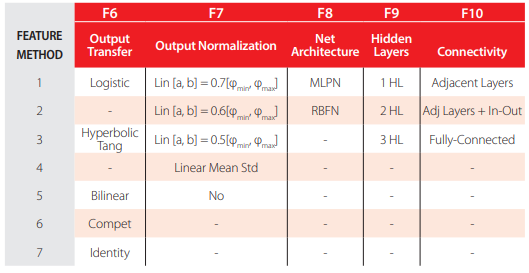
Implemented ANN features (F) 6-10.
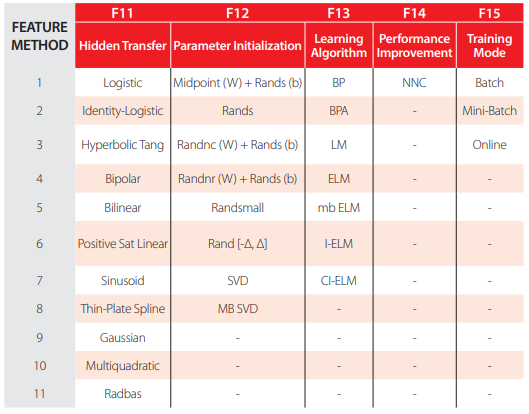
Implemented ANN features (F) 11-15.
Network Performance Assessment
Several types of results were computed to assess network outputs, namely (i) maximum error, (ii) % errors greater than 3%, and (iii) performance, which are defined next. All abovementioned errors are relative errors (expressed in %) based on the following definition, concerning a single output variable and data pattern,
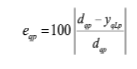 (1)
(1)where (i) dqp is the qth desired (or target) output when pattern p within iteration i (p=1,…, Pi) is presented to the network, and (ii) yqLp is net’s qth output for the same data pattern. Moreover, denominator in eq. (1) is replaced by 1 whenever |dqp| < 0.05 – dqp in the nominator keeps its real value. This exception to eq. (1) aims to reduce the apparent negative effect of large relative errors associated to target values close to zero. Even so, this trick may still lead to (relatively) large solution errors while groundbreaking results are depicted as regression plots (target vs. predicted outputs).
Maximum Error
This variable measures the maximum relative error, as defined by eq. (1), among all output variables and learning patterns.
Percentage of Errors > 3%
This variable measures the percentage of relative errors, as defined by eq. (1), among all output variables and learning patterns, that are greater than 3%.
Performance
In functional approximation problems, network performance is defined as the average relative error, as defined in eq. (1), among all output variables and data patterns being evaluated (e.g., training, all data).
Software Validation
Several benchmark datasets/functions were used to validate the developed software, involving low- to high-dimensional problems and small to large volumes of data. Due to paper length limit, validation results are not presented herein, but they were made public online [49].
Parametric Analysis Results
Aiming to reduce the computing time by cutting in the number of combos to be run —note that all features combined lead to hundreds of millions of combos— the whole parametric simulation was divided into nine parametric SAs, where in each one feature 7 only takes a single value. This measure aims to make the performance ranking of all combos within each “small” analysis more “reliable,” since results used for comparison are based on target and output datasets as used in ANN training and yielded by the designed network, respectively (they are free of any postprocessing that eliminates output normalization effects on relative error values). Whereas (i) the 1st and 2nd SAs aimed to select the best methods from features 1, 2, 5, 8 and 13 (all combined), while adopting a single popular method for each of the remaining features (F3: 6, F4: 2, F6: {1 or 7}, F7: 1, F9: 1, F10: 1, F11: {3, 9 or 11}, F12: 2, F14: 1, F15: 1—see Tables 2-4)—SA 1 involved learning algorithms 1-3 and SA 2 involved the ELM-based counterpart; (ii) the 3rd – 7th SAs combined all possible methods from features 3, 4, 6 and 7, and concerning all other features, adopted the methods integrating the best combination from the aforementioned first SA; (iii) the 8th SA combined all possible methods from features 11, 12 and 14, and concerning all other features, adopted the methods integrating the best combination (results compared after postprocessing) among the previous five sub- analyses; and lastly (iv) the 9th SA combined all possible methods from features 9, 10 and 15, and concerning all other features, adopted the methods integrating the best combination from the previous analysis. Summing up the ANN feature combinations for all parametric SAs, a total of 475 combos were run for this work.
ANN feature methods used in the best combo from each of the abovementioned nine parametric sub-analyses are specified in Table 5 (the numbers represent the method number as in Tables 2-4). Table 6 shows the corresponding relevant results for those combos, namely (i) maximum error, (ii) % errors > 3%, (iii) performance (all described in section 3, and evaluated for all learning data), (iv) total number of hidden nodes in the model, and (v) average computing time per example (including data pre- and post-processing). All results shown in Table 6 (i) were obtained for single ANNs only, since no NNC networks yielded better results for this particular problem, and (ii) are based on target and output datasets computed in their original format, i.e., free of any transformations due to output normalization and/or dimensional analysis. The microprocessors used in this work have the following features: OS: Win10Home 64bits, RAMs: 48 GB, Local Disk Memory: 1 TB, CPUs: Intel® Core™ i7 8700K @ 3.70-4.70 GHz.

ANN feature (F) methods used in the best combo from each parametric sub-analysis (SA).

Performance results for the best design from each parametric sub-analysis.
Proposed ANN-Based Model
The proposed model is the one, among the best ones from all parametric SAs, exhibiting the lowest maximum error (SA 9). That model is characterized by the ANN feature methods {1, 2, 6, 3, 5, 5, 5, 1, 2, 3, 3, 5, 3, 1, 3} in Tables 2-4. Aiming to allow implementation of this model by any user, all variables/equations required for (i) data preprocessing, (ii) ANN simulation, and (iii) data postprocessing are presented in 3.7.1-3.7.3, respectively. The proposed model is a single MLPN with four layers and a distribution of nodes/layer of 7-14-14-1. Concerning connectivity, the network is fully-connected, and the hidden and output transfer functions are all Hyperbolic Tangent and Bilinear, respectively. The network was trained using the Levenberg-Marquardt algorithm (978 epochs). After design, the average network computing time concerning the presentation of a single example (including data pre/postprocessing) is 1.35E-04 s—Figure 4 depicts a simplified scheme of some network key features. Lastly, all relevant performance results concerning the proposed ANN are illustrated in 3.7.4. The obtained ANN solution for every data point can be found in [40].
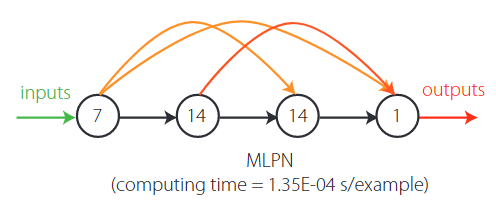
Proposed 7-14-14-1 fully-connected MLPN—simplified scheme.
It is worth recalling that, in this manuscript, whenever a vector is added to a matrix, it means the former is to be added to all columns of the latter (valid in MATLAB).
Input Data Preprocessing
For future use of the proposed ANN to simulate new data Y1,sim (7 x Psim matrix), concerning Psim patterns, the same data preprocessing (if any) performed before training must be applied to the input dataset. That preprocessing is defined by the methods used for ANN features 2, 3 and 5 (respectively 2, 6 and 5—see Table 2), which should be applied after all (eventual) qualitative variables in the input dataset are converted to numerical (using feature 1’s method). Next, the necessary preprocessing to be applied to Y1,sim, concerning features 2, 3 and 5, is fully described.
Dimensional Analysis and Dimensionality Reduction
Since dimensional analysis (d.a.) and dimensionality reduction (d.r.) were not carried out, one has
 (2)
(2)Input Normalization
After input normalization, the new input dataset is defined as a function of the previously determined , and they have the same size, reading
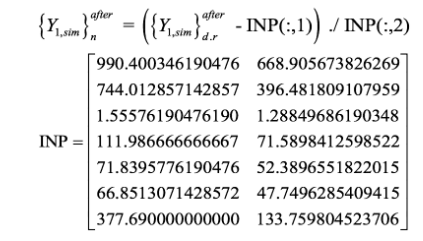 (3)
(3)ANN-Based Analytical Model
Once the preprocessed input dataset {Y1,sim}nafter(7 x Psim matrix) is determined, the next step is to present it to the proposed ANN to obtain the predicted output dataset {Y4,sim}nafter (1 x Psim vector), which will be given in the same preprocessed format of the target dataset used in learning. In order to convert the predicted outputs to their “original format” (i.e., without any transformation due to normalization or dimensional analysis—the only transformation visible will be the (eventual) qualitative variables written in their numeric representation), some postprocessing is needed, as described in detail in 3.7.3. Next, the mathematical representation of the proposed ANN is given, so that any user can implement it to determine {Y4,sim}nafter , thus eliminating all rumors that ANNs are “black boxes.”
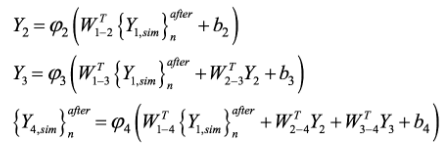 (4)
(4)where
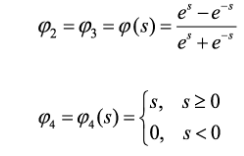 (5)
(5)Arrays Wj-sand bs are stored online in Developer (2018b) [50], aiming to avoid an overlong article and ease model’s implementation by any interested reader.
Output Data Postprocessing
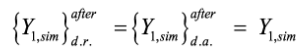
In order to transform the output dataset obtained by the proposed ANN, {Y4,sim}nafter (1 x Psim vector), to its original format (Y4,sim), i.e., without the effects of dimensional analysis and/or output normalization (possibly) taken in target dataset preprocessing prior training, one has
 (6)
(6)since no output normalization nor dimensional analysis were carried out.
Performance Results
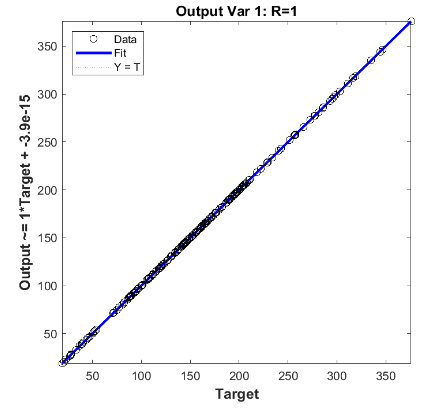
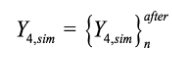
Finally, results yielded by the proposed ANN, in terms of performance variables defined in sub-section 3.4, are presented in this section in the form of several graphs: (i) a regression plot per output variable (Figure 5), where network target and output data are plotted, for each data point, as x- and y- coordinates, respectively—a measure of quality is given by the Pearson Correlation Coefficient (R); (ii) a performance plot (Figure 6), where performance (average error) values are displayed for several learning datasets; and (iii) an error plot (Figure 7), where values concern all data (iii1) maximum error and (iii2) % of errors greater than 3%.
Performance plot (mean errors) for the proposed ANN.
ANN-BASED VS. EXISTING MODELS
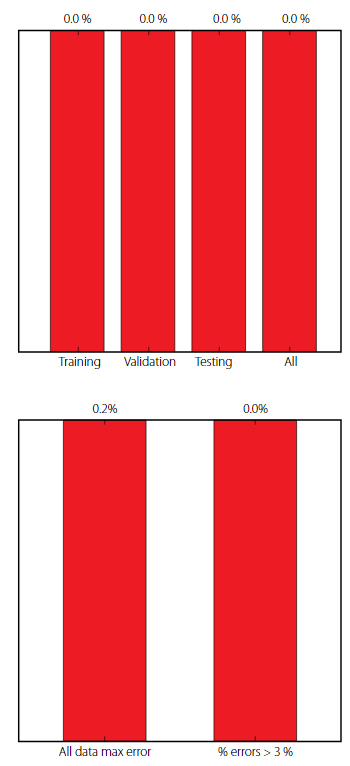
Shear strength of steel I-girders is controlled by buckling and/or shear yielding of the corrugated web. Shear buckling of corrugated webs is often classified as local buckling, global buckling, and interactive buckling, as exemplified in Figure 8 via the FEA-based displacement contours for those elastic buckling modes. Global buckling involves multiple folds and the buckled shape extends diagonally over the height of the web. Local buckling is controlled by deformations within a single “fold” of the web. The interactive shear buckling mode is attributed to the interaction between local and global shear buckling modes.
Shear buckling modes via FEA.
Local shear buckling
The local elastic shear buckling stress of a corrugated web can be predicted using classic plate buckling theory [51]. A single parallel or inclined fold is assumed to be supported by the adjacent folds and steel flanges. The corresponding local elastic shear buckling stress, τecr,L is
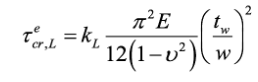 (7)
(7)where (i) w is the maximum fold width, max(b, c), and (ii) kL is the local shear buckling coefficient, which depends on the boundary conditions and the fold aspect ratio – kL lies between 5.34 (assuming simply supported edges) and 8.98 (assuming fixed edges). For practical design purposes, kL=5.34 is recommend by Moon et al. (2009) [24].
Global shear buckling
An expression for the global elastic shear buckling stress of a corrugated steel plate (τecr,G) was developed by Easley and McFarland (1969) [15] using orthotropic plate theory, reading
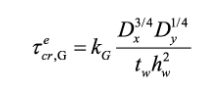 (8)
(8)where (i) kG is the global shear buckling coefficient, and (ii) Dx and Dy are the bending stiffnesses per unit length of the corrugated web with respect to its central principal axes x and y, respectively. Easley (1975) [52] proposed that kG varies between 36 (assuming the web pin-ended by the flanges) and 68.4 (assuming the web fix-ended by the flanges). Elgaaly et al (1996) [19] suggested that kG should be taken as 31.6 for simply supported boundaries and 59.2 for the clamped counterpart. Dx and Dy for trapezoidal corrugated webs can be determined as:
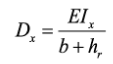 (9)
(9)
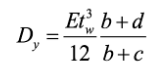 (10)
(10)where Ix is the moment of inertia about the x-axis, Ix = 2btw(hr/2)2 + hr3tw/(6sin α)
Interactive shear buckling
The interactive shear buckling mode is attributed to the interaction between local and global modes and governs shear buckling strength. Lindner & Aschinger (1988) [16] first proposed the corresponding elastic shear buckling stress formula (τecr,I,)
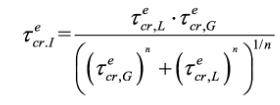 (11)
(11)where exponent n is an integer—several researchers have proposed distinct values [23, 25, 27, 30].
Shear strength
Previous studies [23, 25] have shown that shear strength of corrugated steel webs was generally controlled by interactive shear buckling. In this context, the shear buckling non-dimensional slenderness (λI,n) of a corrugated steel web is defined as
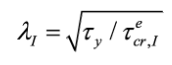 (12)
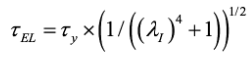
(12)where τy is the tangential yield stress (typically fy / √3, being fy the normal yield stress). Driver et al. (2006) [21] proposed eq. (11) to calculate the shear capacity of corrugated steel webs for all types of shear failures, reading (n=2)
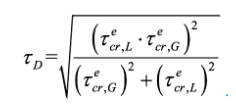 (13)
(13)In case any elastic shear buckling stress (τecr, G or τecr, L) exceeds 80% of the shear yield stress τy, its value in eq. (13) should be replaced by an inelastic counterpart given by Elgaaly et al. (1996) [19].
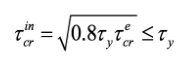 (14)
(14)Metwally (1998) [10] proposed the following equation to calculate the shear capacity of corrugated steel webs (using n=2 in eq. (11))
 (15)
(15)Sauce and Braxtan (2011) [25] summarized a large number of previous experimental data and selected 22 groups of results to fit eq. (16), for the prediction of the shear capacity of corrugated steel webs (using n=3 in eq. (11))
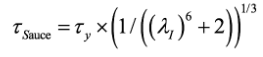 (16)
(16)Leblouba et al. (2017a) [29], based on 113 test results collected from the literature and 12 tests carried out by themselves, developed the following analytical model (based on the hyperbolic Richards equation) to calculate the shear strength of corrugated steel webs (using n=4 in eq. (11))
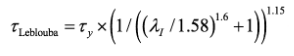 (17)
(17)Figure 9 compares the shear strengths yielded by the analytical models presented before (τD, τEL, τSauce, τLeblouba, τANN) to those obtained experimentally (τe) for the 210 steel girders assessed in this work [40]. The average ratios τD/τe, τEL/τe, τSauce/τe, τLeblouba/τe are 0.78, 0.87, 0.82 and 0.83, with standard deviations of 0.13, 0.16, 0.13 and 0.11, respectively. It can be found that all those models underestimate the shear strength of trapezoidal corrugated web girders. For comparison, the average value of τANN /τe is 1.00, with a standard deviation of 0.00. The major improvement of the proposed ANN-based analytical model (see sub-section 3.7), as compared to the existing calculation methods, is quite clear in Figure 9, where the x-axis shows the predicted shear capacity τmodel (τANN, τD, τEL, τSauce, τLeblouba) and the y-axis shows the experimental counterpart τe.
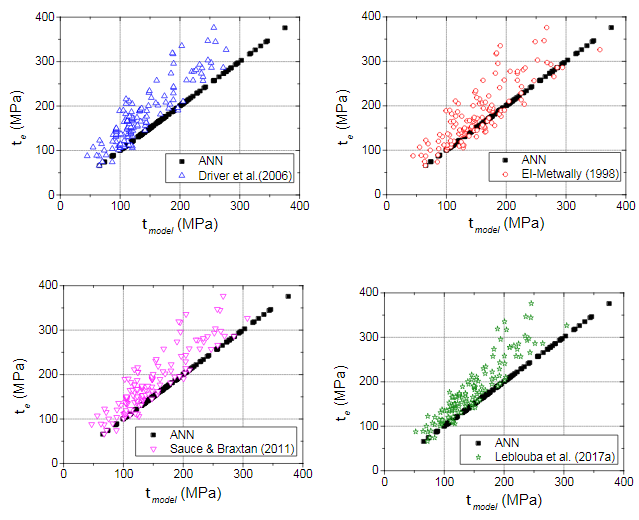
Comparison between tested and predicted shear strength for several proposed models.
DISCUSSION
In future publications it will be guaranteed that the validation and testing data subsets will be composed only by points where at least one variable (which does not have to be the same for all) takes a value not taken in the training subset by that same variable. Based on very recent empirical conclusions by Abambres, the author believes it will lead to more robust ANN-based analytical models concerning their generalization ability (i.e., prediction accuracy for any data point within the variable ranges of the design data).
CONCLUSIONS
This paper describes how artificial neural networks (ANN) can be used to predict the shear capacity of steel girders with a trapezoidal corrugated web and proposes an analytical model for that purpose. The developed model was designed from a 210-point database of test results available in the literature. Seven governing (geometrical and material) parameters were identified as input variables, and the ultimate shear stress (assumed uniform along web’s height) at failure was considered as the target/output variable for the ANN simulations. The proposed ANN-based analytical model yielded maximum and mean relative errors of 0.0% concerning all the 210 test results previously collected. Figure 9 shows that the ANN-based approach clearly outperforms the existing calculation models assessed in this work, for the dataset considered (made available at Developer 2018a)—latter models exhibit mean errors greater than 13%.
The focus of this study was not to assess the mechanics underlying the behavior of corrugated web steel girders, but parametric studies by means of accurate and robust ANN-based models make it possible to evaluate and improve existing mechanical models.
ACKNOWLEDGEMENTS
There are no conflicts of interest to disclose.
CONTRIBUTIONS
He, J. developed sections 1, 2 and 4; Abambres, M. developed sections 3 and 5 (ANN- related); remaining sections had equal contributions from both authors.
REFERENCES
[1] He, J., Liu, Y., Chen, A., & Yoda, T. (2012). Mechanical behavior and analysis of composite bridges with corrugated steel webs: State-of-the-art. International Journal of Steel Structures, 12, 321–338. doi: http://doi.org/10.1007/s13296-012-3003-9
[2] Wu, L., Gao, X., Shi, Y., & Wang, Y. (2006). Theoretical and experimental study on interactive local buckling of arch- shaped corrugated steel roof. International Journal of Steel Structures, 6, 45–54.
[3] Jiang, R., Au, F. T. K., & Xiao, Y. (2015). Prestressed Concrete Girder Bridges with Corrugated Steel Webs : Review. Journal of Structural Engineering, ASCE, 141(2), 1–9. doi: https://doi.org/10.1061/(ASCE)ST.1943-541X.0001040
[4] Emami, F., Mofid, M., & Vafai, A. (2013). Experimental study on cyclic behavior of trapezoidally corrugated steel shear walls. Engineering Structures, 48, 750–762. doi: https://doi.org/10.1016/j.engstruct.2012.11.028
[5] Combault, J. (1988). The Maupre Viaduct Near Charolles, France. Proceedings, AISC Engineering Conference, 12.1- 12.22.
[6] Kondo, M., Shimizu,Y., Kobayashi, K., & Hattori, M. (1994). Design and construction of the Shinkai Bridge-Prestressed concrete bridge using corrugated steel webs. Bridge Found. Eng.,13-20. (in Japanese).
[7] Bergfelt, A., & Leiva-Aravena, L. (1984). Shear Buckling of Trapezoidal Corrugated Girder Webs, Division of Steel and Timber Structures, Chalmers University of Technology, Gothenburg, Publication S 84:2, Sweden, 64p.
[8] Leiva-Aravena, L., & Edlund, B. (1987). Buckling of trapezoidally corrugated webs. In: ECCS colloquium on stability of plates and shells. Belgium: Ghent University.
[9] Johnson, R. P., & Cafolla, J. (1997). Local flange buckling in plate girders with corrugated steel webs. Proceedings of the Institution of Civil Engineers – Structures and Buildings, 123, 148-156. doi: https://doi.org/10.1680/istbu.1997.29304
[10] Metwally, A. E. (1998). Prestressed composite girders with corrugated steel webs. M.S. thesis. Calgary (AB): Dept. of Civil Engineering, University of Calgary.
[11] Sayed-Ahmed, E. Y. (2001). Behaviour of steel and/or composite girders with corrugated steel webs. Canadian Journal of Civil Engineering, 28(4), 656-672. doi: https://doi.org/10.1139/l01-027
[12] Sayed-Ahmed, E. Y. (2007). Design aspects of steel I-girders with corrugated steel webs. Electronic Journal of Structural Engineering, 7, 27-40.
[13] Abbas, H. H. (2003). Analysis and design of corrugated web I-girders for bridges using high performance steel. Ph.D. dissertation. Bethlehem (PA): Dept. of Civil and Environmental Engineering, Lehigh University.
[14] Shimada, S. (1965). Shear strength of steel plate girders with folded web plate (Ripple Web Girders). Proceeding of JSCE, 124, 1-10. (in Japanese). doi: https://doi.org/10.2208/jscej1949.1965.124_1
[15] Easley, J. T., & McFarland, D. E. (1969). Buckling of light-gage corrugated metal shear diaphragms. Journal of the Structural Division, ASCE, 95(ST7), 1497-516.
[16] Lindner, J., & Aschinger, R. (1988). Grenzschubtragfähigkeit von I-Tägern mit trapezförmig profilierten Stegen. Stahlbau, 57(12), 377-80. (in German).
[17] Luo, R., & Edlund, B. (1994). Buckling analysis of trapezoidally corrugated panels using spline finite strip method. Thin-walled structures, 18, 209-224. doi: https://doi.org/10.1016/0263-8231(94)90019-1
[18] Luo, R., & Edlund, B. (1996). Shear capacity of plate girders with trapezoidally corrugated webs. Thin-walled structures, 26, 19-44. doi: https://doi.org/10.1016/0263-8231(96)00006-7
[19] Elgaaly, M., Hamilton, R. W., & Seshadri, A. (1996). Shear strength of beams with corrugated webs. Journal of Structural Engineering, ASCE, 122(4), 390-8. doi: https://doi.org/10.1061/(ASCE)0733-9445(1996)122:4(390)
[20] Yamazaki, M. (2001). Buckling strength of corrugated webs. Journal of Structural Engineering, JSCE, 47A, 19-26. (in Japanese).
[21] Driver, R. G., Abbas, H. H., & Sause, R. (2006). Shear behavior of corrugated web bridge girders. Journal of Structural Engineering, ASCE, 32(2), 195–203. doi: https://doi.org/10.1061/(ASCE)0733-9445(2006)132:2(195)
[22] Watanabe, K., Uchida, S., & Kubo, M. (2007). Shear buckling capacity of steel girders with corrugated webs. Journal of Structural Engineering, JSCE, 53A, 13-24. (in Japanese). doi: https://doi.org/10.11532/structcivil.53A.13
[23] Yi, J., Gil, H., Youm, K., & Lee, H. (2008). Interactive shear buckling behavior of trapezoidally corrugated steel webs. Engineering Structures, 30(6), 1659-66. doi: https://doi.org/10.1016/j.engstruct.2007.11.009
[24] Moon, J., Yi, J., Choi, B. H., & Lee, H. E. (2009). Shear strength and design of trapezoidally corrugated steel webs. Journal of Constructional Steel Research, 65(5), 1198-205. doi: https://doi.org/10.1016/j.jcsr.2008.07.018
[25] Sause, R., & Braxtan,T. N. (2011). Shear strength of trapezoidal corrugated steel webs. Journal of Constructional Steel Research, 67, 223-236. doi: https://doi.org/10.1016/j.jcsr.2010.08.004
[26] Nie, J., Zhu, L., Tao, M., & Tang, L. (2013). Shear strength of trapezoidal corrugated steel webs. Journal of Constructional Steel Research, 85, 105–115. doi: https://doi.org/10.1016/j.jcsr.2013.02.012
[27] Hassanein, M. F., & Kharoob, O. F. (2013a). Behavior of bridge girders with corrugated webs: (I) Real boundary condition at the juncture of the web and flanges. Eng. Struct. 57, 554–564. doi: https://doi.org/10.1016/j.engstruct.2013.03.004
[28] Hassanein, M. F., & Kharoob, O. F. (2013b). Behavior of bridge girders with corrugated webs: (II) Shear strength and design. Engineering Structures, 57, 544–553. doi: https://doi.org/10.1016/j.engstruct.2013.04.015
[29] Leblouba, M., Barakat, S., Altoubat, S., Junaid, M. T., & Maalej, M. (2017a). Normalized shear strength of trapezoidal corrugated steel webs. Journal of Constructional Steel Research, 136, 75–90. doi: https://doi.org/10.1016/j.jcsr.2017.05.007
[30] Leblouba, M., Junaid, M. T., Barakat, S., Altoubat, S., & Maalej, M. (2017b). Shear buckling and stress distribution in trapezoidal web corrugated steel beams. Thin-Walled Structures, 113, 13–26. doi: https://doi.org/10.1016/j.tws.2017.01.002
[31] EN 1993-1-5. (2005). Eurocode 3: Design of steel structures, Part 1-5: Plated structural elements.
[32] JSCE. (1998). Design manual for PC bridges with corrugated steel webs, Research committee for hybrid structures with corrugated steel webs, Japan. (in Japanese).
[33] Papangelis, J., Trahair, N., & Hancock, G. (2017). Direct strength method for shear capacity of beams with corrugated webs. Journal of Constructional Steel Research, 137, 152–160. doi: https://doi.org/10.1016/j.jcsr.2017.06.007
[34] Hertzmann, A., & Fleet, D. (2012). Machine Learning and Data Mining, Lecture Notes CSC 411/D11, Computer Science Department, University of Toronto, Canada.
[35] McCulloch, W. S., & Pitts, W. (1943). A logical calculus of the ideas immanent in nervous activity. Bulletin of Mathematical Biophysics, 5(4), 115–133. doi: https://doi.org/10.1007/BF02478259
[36] Hern, A. (2016). Google says machine learning is the future. So I tried it myself. Available at: www.theguardian.com/technology/2016/jun/28/all (Accessed: 2 November 2016).
[37] Wilamowski, B. M., & Irwin, J. D. (2011). The industrial electronics handbook: Intelligent Systems, CRC Press, Boca Raton.
[38] Prieto, A., Prieto, B., Ortigosa, E. M., Ros, E., Pelayo, F., Ortega, J., & Rojas, I. (2016). Neural networks: An overview of early research, current frameworks and new challenges. Neurocomputing, 214, 242-268. doi: https://doi.org/10.1016/j.neucom.2016.06.014
[39] Flood, I. (2008).Towards the next generation of artificial neural networks for civil engineering. Advanced Engineering Informatics, 228(1), 4-14. doi: https://doi.org/10.1016/j.aei.2007.07.001
[40] Developer (2018a). dataset + target vs output [Data set]. Zenodo. doi: http://doi.org/10.5281/zenodo.2336579
[41] Peil, U. (1998). Statische versuche an trapezstegtr¨agern untersuchung der querkraftbeanspruchbarkeit, Institut für Stahlbau. Braunschweig (Germany): Technischen Universität Braunschweig.
[42] Sause, R., & Clarke, T. (2003). Bearing Stiffeners and Field Splices for Corrugated Web Girders, Technical Report.
[43] Sause, R., Abbas, H. H., Wassef, W., Driver, R. G., & Elgaaly, M. (2003). Corrugated web girder shape and strength criteria, Technical Report.
[44] Gil, H., Lee, S., Lee, J., & Lee, H. (2005). Shear buckling strength of trapezoidally corrugated steel webs for bridges. In Transportation Research Board – 6th International Bridge Engineering Conference: Reliability, Security, and Sustainability in Bridge Engineering (pp. 473-480).
[45] He, J. (2011). Mechanical performance and design method of composite bridge with corrugated steel webs. Ph.D. dissertation, Tongji University, Shanghai, China.
[46] Abambres, M., Marcy, M., & Doz, G. (2019). Potential of Neural Networks for Structural Damage Localization. ACI – Avances en Ciencias e Ingenierías, 11(2). doi: http://dx.doi.org/10.18272/aci.v11i2.1305
[47] Abambres, M., Rajana, K., Tsavdaridis, K., & Ribeiro, T. (2018). Neural Network-based formula for the buckling load prediction of I-section cellular steel beams. Computers, 8(1), 1-26. doi: https://doi.org/10.3390/computers8010002
[48] The Mathworks, Inc (2017). MATLAB R2017a, User’s Guide, Natick, USA.
[49] The Researcher. (2018b).“Ann software validation-report. pdf”, figureshare, doi: 10.6084/m9.figureshare.6962873
[50] Developer (2018b). W and b arrays [Data set]. Zenodo, doi: http://doi.org/10.5281/zenodo.2341590
[51] Timoshenko, S. P., & Gere, J. M. (1961). Theory of elastic stability. New York, NY: McGraw-Hill.
[52] Easley, J. T. (1975). Buckling formulas for corrugated metal shear diaphragms. Journal of Structural Division, ASCE. 101(7), 1403–1417.