

Rainfall Trend and Rainfall Design Values in the upper part of Ecuadorian Andean Mountains and their implications on Hydropower Projects
Tendencia de lluvia y valores de diseño para lluvia en la parte superior de las montañas andinas ecuatorianas y sus implicaciones en proyectos hidroeléctricos
ACI Avances en Ciencias e Ingenierías
Universidad San Francisco de Quito, Ecuador
Received: 27 March 2018
Accepted: 25 October 2019
Abstract: Rainfall in the upstream drainage area of the Ecuadorian Andean Mountains (EAM) is an important source of runoff for the main hydropower projects. Although understanding the interaction between rainfall-runoff processes is a difficult task, it is important to understand these mechanisms in order to manage water resource projects. Although there are several local and regional mechanisms that control seasonal, annual, decadal and extreme rainfall variation, it is important to analyze the tools that are widely used in the hydraulic design of hydropower structures. Among other statistical resources, hydraulic civil engineers use the Gumbel Method to study extreme precipitation events, as well as mean and median statistical values to evaluate water availability in the design of a project. In addition, the analysis of rainfall-runoff processes depends on data availability. The main question at the heart of this study is: How can rainfall trends in the highlands of the Ecuadorian Andean Mountains be integrated to rainfall design of hydraulic structures of hydropower projects? The justifications of this question are as follows: First, the occurrence of extreme precipitation events increases the risk of flooding, resulting in the failure of the spillway’s dams. Second, changes in annual rainfall variation could lead to water scarcity in the management of water resource projects. Additionally, we compared the extreme precipitation events with ENSO years. This study focuses on improving the understanding of rainfall trends at EAM and its implications in the management of hydraulic structures.
Keywords: El Niño, La Niña, rainfall, event, hydropower.
Resumen: La lluvia en el área de drenaje corriente arriba de las montañas andinas ecuatorianas (EAM) es una fuente importante de escorrentía para los principales proyectos hidroeléctricos. Si bien comprender la interacción entre los procesos de lluvia y escorrentía es una tarea difícil, es importante comprender estos mecanismos para gestionar los proyectos de recursos hídricos. Si bien existen varios mecanismos locales y regionales que controlan la variación estacional, anual, decenal y de precipitación extrema, es importante analizar las herramientas que se utilizan ampliamente en el diseño hidráulico de estructuras hidroeléctricas. Entre otros recursos estadísticos, los ingenieros civiles hidráulicos utilizan el Método Gumbel para estudiar eventos extremos de precipitación, así como valores estadísticos medios y medianos para evaluar la disponibilidad de agua en el diseño de un proyecto. Además, el análisis de los procesos de precipitación y escorrentía depende de los datos disponibles. La pregunta principal del centro de este estudio es: ¿Cómo se pueden integrar las tendencias de lluvia en las tierras altas de las montañas andinas ecuatorianas al diseño de lluvia de las estructuras hidráulicas de los proyectos hidroeléctricos? Las justificaciones de esta pregunta son las siguientes: Primero, la ocurrencia de eventos de precipitación extrema aumenta el riesgo de inundación, lo que resulta en la falla de las represas del vertedero. En segundo lugar, los cambios en la variación anual de las precipitaciones podrían provocar escasez de agua en la gestión de los proyectos de recursos hídricos. Además, comparamos los eventos extremos de precipitación con los años de ENSO. Este estudio se enfoca en mejorar la comprensión de las tendencias de lluvia en EAM y sus implicaciones en el manejo de estructuras hidráulicas.
Palabras clave: El Niño, La Niña, lluvia, evento, energía hidroeléctrica.
INTRODUCTION
Mountain ecosystems contain important natural resources which play a decisive role in ecological and economic processes worldwide [1]. In Ecuador, the Andean Mountains, at over 3,000 MASL, represent 6.6% of its continental area and influence runoff which interacts with important water resource projects for the main cities in Ecuador, such as Quito, Ibarra, Riobamba, Cuenca, and Ambato. In addition, these zones are the harbor of the highland system, between 3,000 and 4,500 MASL, which interacts biogeochemically, thereby generating runoff sources [2,3].
The complexity in understanding how different pathways of diverse sources such as groundwater, precipitation, and snowpack contribute to runoff sources downstream makes it difficult to create rainfall-runoff models [4]. In addition to this complexity, rainfall in the Andean Mountain environment can present high spatial and temporal variations [2].
Water management projects are based on the construction of hydraulic features which rely on flood hydrology studies that are based on robust rainfall and runoff data [5]. The difficult access to these high altitudes has made hydro-meteoric stations scarce. The limited distribution of gauge stations in the Ecuadorian Andean Mountains also limited flood data. As a result, hydrologists use probability methods to define the design of flood hydrographs, which depend on extreme rainfall events. Nevertheless, the rainfall data available during the last decades was useful in designing several hydraulic structures.
Rollenbeck and Bendix [6] explained how complex patterns of rainfall formation in space and time are related to different mechanisms that interact with small and large topographic features. Large-scale mechanisms in rainfall are mainly influenced by atmospheric processes, such as the tropical easterlies coming from the Amazon forest.
Also, the local and regional mechanisms interact with topography. Furthermore, there are other global factors that influence rainfall. These factors are El Niño-Southern Oscillation (ENSO), Pacific Decadal Oscillation (PDO), and Intertropical Convergence Zone (ITCZ) [7].
Extreme precipitation events are quick and unexpected, and they have higher amounts of accumulated rainfall in a few minutes. These events pose risks to hydraulic structures and their operation systems. As a consequence, extreme rainfall events could be affected, causing loss of life, as well as rising food and energy costs. This work aims to expose the importance of the study of the influence of rainfall variation in the Ecuadorian highlands and link the results to the possible impacts on hydropower projects.
We used daily rainfall data of the Ecuadorian National Hydrological and Meteorological Institute (INAMHI) of 35 gauge stations in the Ecuadorian Andean Mountains (EAM) located above an elevation of 3,000 m. We analyzed how decadal rainfall variation and extreme rainfall could affect the management of the main hydropower projects. Additionally, we compared the extreme rainfall events to global processes such as ENSO. The extreme precipitation events were evaluated using Gumbel’s probability curve, which is mostly used in the design of hydraulic structures in Ecuador.
METHODOLOGY
This is an applied research in civil engineering structures. Among these, we considered the most relevant hydropower projects in Ecuador. The analysis of data is based on local data available in the Hydrological and Meteorological Center of Ecuador (INAMHI), while the creation of maps of the geomorphic characteristics are based on the use of Geographical Information System (GIS) tools. The process that we used in the present study is shown in Figure 2.
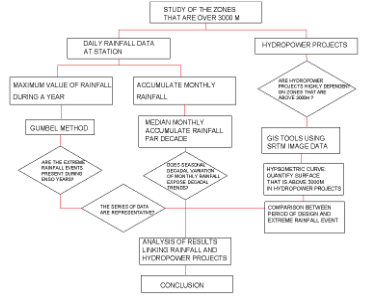
Methodology of the Analysis of Rainfall trends in the EAM
We chose the zones above 3,000 m because these areas produce runoff sources that are important for local hydraulic structures and hydropower projects downstream in Ecuador. The rainfall data at each station is used to calculate the probability of extreme rainfall using the Gumbel Method. The name of the station has a prefix M, and the identification numbers are the same as those used by the INAMHI. The statistical results are presented in Figures 5 and 6. These figures represent mean accumulated annual rainfall and accumulated median monthly rainfall variation, respectively.
A summary of the data availability registered in each station located in the zone of study is presented in Table 1. The percentage of availability is calculated by comparing the amount of data registered daily in each station with the maximum of data that should have been registered daily each month.
| period | years | M001 | M003 | M023 | M102 | M120 | M141 | M188 | M308 | M344 | M354 | M357 | M364 | ||||
| 1962-2015 | 53 | 71% | 96% | 60% | 92% | 79% | 91% | 83% | 73% | 76% | 84% | 72% | 89% | ||||
| 1962-1964 | 2 | 0% | 0% | 0% | 58% | 0% | 0% | 21% | 0% | 0% | 0% | 0% | 0% | ||||
| 1964-1974 | 11 | 1% | 99% | 2% | 92% | 100% | 100% | 93% | 3% | 91% | 78% | 0% | 74% | ||||
| 1975-1984 | 10 | 86% | 100% | 98% | 99% | 98% | 98% | 98% | 98% | 98% | 81% | 97% | 98% | ||||
| 1985-1994 | 10 | 99% | 100% | 55% | 94% | 72% | 90% | 97% | 98% | 88% | 90% | 98% | 98% | ||||
| 1995-2004 | 10 | 100% | 100% | 87% | 97% | 54% | 95% | 54% | 98% | 30% | 100% | 97% | 98% | ||||
| 2005-2015 | 10 | 100% | 100% | 83% | 86% | 82% | 88% | 86% | 98% | 84% | 90% | 98% | 98% | ||||
| period | years | M369 | M371 | M376 | M377 | M385 | M390 | M393 | M396 | M399 | M409 | M411 | M414 | ||||
| 1962-2015 | 53 | 94% | 83% | 92% | 86% | 76% | 62% | 94% | 88% | 84% | 76% | 83% | 86% | ||||
| 1962-1964 | 2 | 33% | 29% | 0% | 0% | 0% | 29% | 13% | 0% | 0% | 0% | 0% | 0% | ||||
| 1964-1974 | 11 | 92% | 83% | 88% | 77% | 43% | 91% | 91% | 86% | 84% | 47% | 89% | 74% | ||||
| 1975-1984 | 10 | 99% | 98% | 99% | 99% | 95% | 82% | 97% | 97% | 81% | 70% | 99% | 90% | ||||
| 1985-1994 | 10 | 98% | 87% | 100% | 98% | 73% | 28% | 99% | 94% | 91% | 99% | 58% | 93% | ||||
| 1995-2004 | 10 | 97% | 72% | 99% | 98% | 95% | 33% | 98% | 94% | 82% | 89% | 86% | 93% | ||||
| 2005-2015 | 10 | 98% | 88% | 94% | 79% | 95% | 77% | 100% | 84% | 99% | 95% | 99% | 100% | ||||
| period | years | M417 | M535 | M1066 | M1111 | M1130 | M1167 | M1183 | M1209 | M1212 | M1231 | M1261 | |||||
| 1962-2015 | 53 | 66% | 58% | 46% | 28% | 10% | 9% | 16% | 16% | 16% | 9% | 4% | |||||
| 1962-1964 | 2 | 0% | 0% | 0% | 0% | 0% | 0% | 0% | 0% | 0% | 0% | 0% | |||||
| 1964-1975 | 11 | 1% | 90% | 0% | 0% | 0% | 0% | 0% | 0% | 0% | 0% | 0% | |||||
| 1975-1985 | 10 | 100% | 59% | 0% | 0% | 0% | 0% | 0% | 0% | 0% | 0% | 0% | |||||
| 1985-1995 | 10 | 99% | 34% | 65% | 0% | 0% | 0% | 0% | 0% | 0% | 0% | 0% | |||||
| 1995-2005 | 10 | 83% | 13% | 88% | 53% | 9% | 0% | 40% | 0% | 1% | 0% | 0% | |||||
| 2005-2015 | 10 | 76% | 100% | 98% | 99% | 43% | 49% | 46% | 87% | 88% | 49% | 20% |
Data available during a period in the Rainfall Stations in the EAM (red color describes no data available. Green represents that series of data is almost complete.)
The analysis of extreme precipitation is based on the comparison of the largest extreme precipitation event within ENSO years indicated by the Earth System Research Laboratory (ESRL). Gumbel Curves of extreme rainfall events helped to identify the period of return. Later, this period of return was used in the analysis of the hydraulic structures considering their period of design. Figure 8 shows the Gumbel curves of the stations that have had robust data since 1964. These stations are M003, M102, M141, M369, M141, M369, M376, M377, M393 and M396. The decadal variation of the mean values of accumulated monthly rainfall in the same stations is presented in Figure 9.
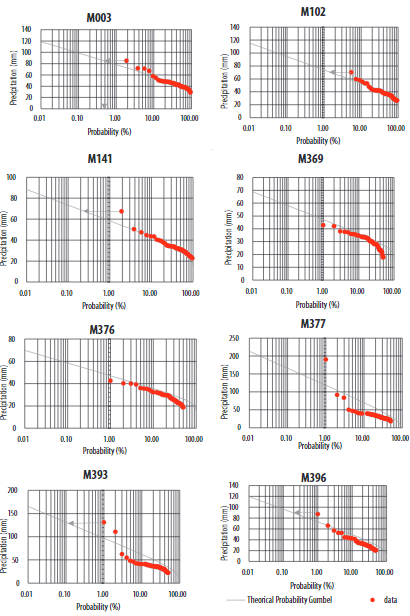
Gumbel probability curves in rainfall stations M003, M102, M141, M369, M376, M377, M393 and
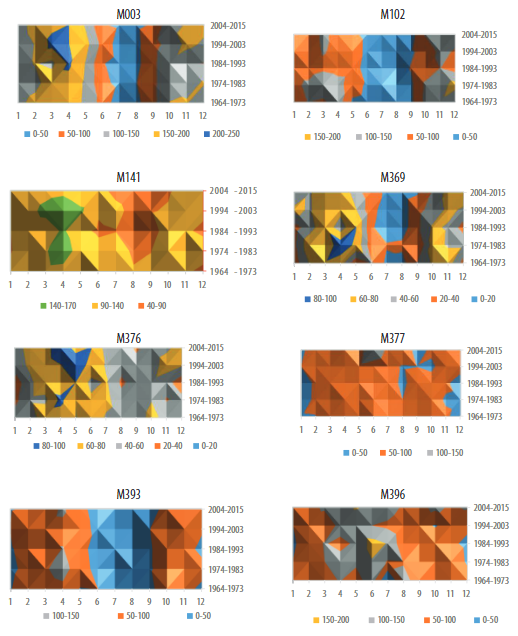
Decadal Variation in Rainfall Stations at EAM, legend shows accumulated median monthly rainfall in mm.
AREA OF RESEARCH
The zone of study is located in the region of the Ecuadorian Andean Mountains with more than 3000 meters of elevation. The zone of study has an area of 16,413 km2 and represents 6.6% percent of the continental part of Ecuador (250,041 km2). The area extends from latitude 5.00°S – 1.50°N, longitude 79.53° – 77.50°, composed of mountains that can reach 6,263 m in the case of Chimborazo Mountain. Figure 1 geographically shows the zone of study and the main mountains that are distributed in the EAM. These types of mountains are the main sources of snowpack in the tributaries. The drainage area of the EAM influence downstream to the main hydropower projects that are listed in Table 2.
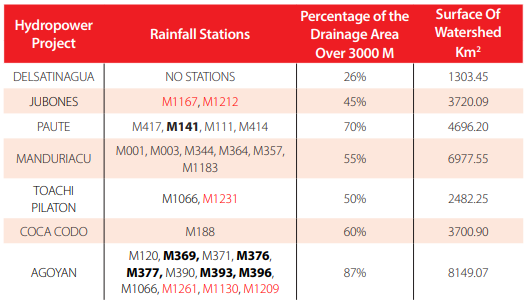
Hydropower projects in Ecuador and the percentage of the drainage area that contributes to these projects in the EAM. Locations of dams are shown in Figure 7. Stations in red do not have data during the period 1962-2005.
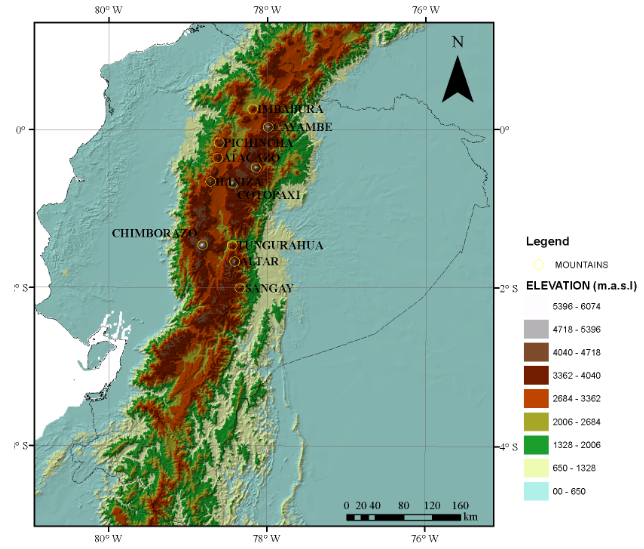
Location of zone of study
Rainfall Database
The Ecuadorian National Hydrological and Meteorological Institute (INAMHI) has collected weather data in Ecuador since 1962 at altitudes ranging from 3,000 MASL at M102 to 3780 MASL at M357. This zone of study contains 35 stations, listed in Table 3. None of them have 100% of the daily data complete during the period 1964-2015. Complete daily rainfall records at the stations is important to manage water resources. The zone of study contains the following stations: M003, M102, M141, M369, M376, M377, M393, M396, M399, and M414, which have almost complete data. The stations M1130, M1167, M1183, M1209, M1212, M1231, and M1261 do not have data for the period 1962- 2005 and have incomplete data during the last decade. The spatial distribution of these stations is exposed in Figure 2.
| STATION NAME PERIOD ELEVATION STATISTICAL EXTREME MEAN EXTREME STANDARD BEGIN END (m.a.s.l.) VALUES DEVIATION (mm) 1 M001 INGUINCHO 1977 2015 3140 50,2 18,4 2 M003 IZOBAMBA 1964 2015 3058 42,7 11,3 3 M023 OLMEDO-PICHINCHA 1975 2015 3120 39,5 20,8 4 M102 EL ANGEL 1962 2015 3000 37,5 11,5 5 M120 COTOPAXI-CLIRSEN 1964 2014 3510 31,0 7,7 6 M141 EL LABRADOR 1964 2014 3335 32,2 8,3 7 M188 PAPALLACTA 1963 2014 3150 52,3 25,4 8 M308 TUFIÑO 1975 2015 3418 45,9 13,4 9 M344 CANGAHUA 1964 2015 3140 33,0 9,5 10 M354 SAN JUAN-PICHINCHA (CHILLOG.) 1965 2015 3440 37,5 20,7 11 M357 CANAL 10 TV. 1976 2015 3780 49,8 10,1 12 M364 LORETO PEDREGAL 1964 2015 3620 46,2 21,5 13 M369 CUSUBAMBA 1963 2015 3175 29,1 7,8 14 M371 PASTOCALLE 1963 2015 3074 39,6 40,9 15 M376 PILAHUIN 1964 2015 3314 27,2 6,3 16 M377 TISALEO 1964 2015 3266 35,6 26,4 17 M385 SALINAS-BOLIVAR 1969 2015 3600 41,2 50,8 18 M390 URBINA 1963 2015 3610 27,7 10,7 19 M393 SAN JUAN-CHIMBORAZO 1963 2015 3220 37,4 19,0 20 M396 ALAO 1964 2014 3200 32,4 12,9 21 M399 ACHUPALLAS-CHIMBORAZO 1964 2015 3178 32,9 10,5 22 M409 PANGOR-J. DE VELASCO (H. TEPEYAC) 1970 2015 3109 32,1 41,9 23 M411 INGAPIRCA 1964 2015 3100 30,7 12,4 24 M414 CHANIN 1964 2015 3270 41,9 20,1 25 M417 PISCICOLA CHIRIMICHAY 1976 2014 3270 39,1 14,8 26 M535 LAS HERRERIAS 1964 2015 3650 38,8 23,5 27 M1066 COTOPILALO 1988 2015 3250 30,0 7,8 28 M1111 CHANLUD 2000 2015 3336 17,2 19,7 29 M1130 SHIRY XII 2011 2015 3028 10,2 24,5 30 M1167 SABADEL 2011 2015 3238 10,1 25,5 31 M1183 RUNDOPAMBA 2013 2015 3351 17,8 24,2 32 M1209 TOTORILLAS 2005 2015 3207 14,4 21,0 33 M1212 PUCARA-CO 2004 2015 3113 10,6 15,7 34 M1231 ILLINIZA 2011 2015 3460 6,3 14,2 35 M1261 ILAPO 2014 2015 3466 3,2 10,3 |
Summary of the analysis of extreme daily rainfall trends
| DAILY RAINFALL PARAMATERS | GUMBEL | |||||
| MAXIMUM RAINFALL REGISTERED | PROBABILITY EXPERIENCED (PERIOD) | YEAR MAXIMUM RAIFALL | ENSO EVENT | 0.1% (1000 years) | 1% (100 years) | 10% (10 years) |
| (mm) | (mm) | (mm) | (mm) | |||
| 140,5 | 0.1% (1000 years) | 1994 | 141,2 | 108,0 74,2 | ||
| 84,5 | 1% (100 years) | 2009 | 98,0 | 78,0 57,4 | ||
| 31,9 | 1% (100 years) | 1990 | 142,4 | 104,9 66,7 | ||
| 0,8 | 1% (100 years) | 1962 | LA NIÑA | 94,4 | 76,7 52,5 | |
| 9,8 | 10% (10 years) | 2012 | LA NIÑA | 60,4 | 48,6 36,6 | |
| 7,3 | 1% (100 years) | 2000 | LA NIÑA | 73,4 | 58,4 43,1 | |
| 83,0 | 0.1% (1000 years) | 2003 | EL NIÑO | 177,6 | 131,9 85,4 | |
| 2,0 | 1% (100 years) | 1992 | EL NIÑO | 112,2 | 88,1 63,4 | |
| 0,4 | 1% (100 years) | 1971 | LA NIÑA | 79,8 | 62,8 45,4 | |
| 20,6 | 1% (100 years) | 1967 | 139,4 | 102,3 64,4 | ||
| 72,6 | 10% (10 years) | 2012 | LA NIÑA | 99,8 | 81,6 63,0 | |
| 137,0 | 1% (100 years) | 1989 | LA NIÑA | 152,6 | 113,8 74,4 | |
| 59,8 | 1% (100 years) | 2003 | EL NIÑO | 67,8 | 53,7 39,3 | |
| 56,2 | 0.1% (1000 years) | 1969 | 241,5 | 168,0 93,0 | ||
| 42,5 | 10% (10 years) | 2004 | 58,5 | 47,1 35,5 | ||
| 90,0 | 0.1% (1000 years) | 2005 | 166,1 | 118,5 70,1 | ||
| 37,3 | 0.1% (1000 years) | 1989 | LA NIÑA | 292,2 | 200,7 107,6 | |
| 8,5 | 10% (10 years) | 1980 | EL NIÑO | 80,4 | 61,2 41,6 | |
| 30,8 | 0.1% (1000 years) | 1964 | 131,2 | 97,0 62,2 | ||
| 87,0 | 1% (100 years) | 1986 | 96,3 | 73,0 49,3 | ||
| 61,6 | 10% (10 years) | 1972 | 87,8 | 65,9 46,6 | ||
| 215,1 | 1% (100 years) | 2009 | 239,2 | 163,7 86,8 | ||
| 83,2 | 1% (100 years) | 1965 | 92,2 | 69,8 47,0 | ||
| 126,6 | 1% (100 years) | 2008 | LA NIÑA | 141,3 | 105,0 68,2 | |
| 83,5 | 1% (100 years) | 1976 | LA NIÑA | 112,2 | 85,5 58,4 | |
| 102,5 | 10% (10 years) | 2008 | LA NIÑA | 227,2 | 121,4 68,5 | |
| 48,0 | 10% (10 years) | 2001 | 68,3 | 54,4 40,2 | ||
| 71,6 | 10% (10 years) | 2015 | 114,5 | 79,0 42,9 | ||
| -- | -- | -- | -- -- | |||
| 111,3 | 2013 | -- | -- -- | |||
| 75,0 | 2000 | -- | -- -- | |||
| 71,1 | 2015 | -- | -- -- | |||
| 45,2 | 2006 | -- | -- -- | |||
| 55,4 | 2011 | -- | -- -- | |||
| -- | -- | -- | -- -- | |||
Statistical Analysis
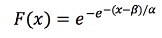
Although missing data could increase the uncertainty of the results, we use all the data to obtain the principal basic statistical parameters to calculate annual and seasonal rainfall distribution presented in Figures 1 and 2. The M003, M102, M141, M369, M376, M377, M393, M396, M399, and M414 stations, which have robust data, are delineated with darker color. For instance, they are analyzed individually considering the results of extreme rainfall trends and decadal variations, as displayed in Figures 8 and 9. The extreme rainfall event is compared to Gumbel’s probability distribution curve. The decadal variation is based on the use of mean values of monthly accumulated rainfall data at the stations. According to the statistical theory of extremes, the Gumbel distribution function F(x) represents the probability of a lower value to x.
 (1)
(1)
 (2)
(2)
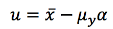 (3)
(3)Where is the arithmetic mean of the sample, is the standard deviation. The values of depend on the number of samples. In the case of the stations with a registration period between 1962 and 2015, the number of data is 54, hence. More details about the use of Gumbel’s distribution is explained in Chow [8]. In addition, we used Excel to calculate the statistical parameters and generate the Gumbel curves in each station. This study is based on the probability analysis of the rainfall events that reach the return period of 10, 100, and 1,000 years to find out if the hydraulic structures in the EAM are vulnerable. The probability value P (%) and the return period for the hydraulic design of the structure T in years have the following relationship: P=T/100.
Hydropower Projects
In order to compare the surface of the EAM contributing to hydropower projects, we used the hypsometric curve of their watersheds. Langbein [9] showed in detail how to make the hypsometric curve presented in Figure 7. The elevation data used in the maps is part of the dataset of the Shuttle Radar Topography Mission (SRTM), with 90 m resolution data.
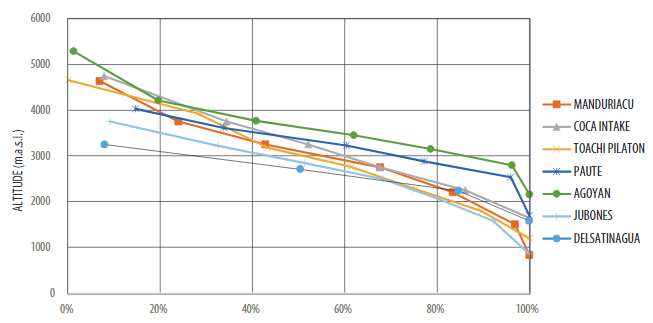
Hypsometric curve of the Watersheds influencing Hydropower Projects in Ecuador
Each hydropower project dam is the lowest part of the watershed, hence its control point. The National Corporation of Ecuador (CELEC) provided information about the locations of the main hydropower projects. Although the hydropower projects are composed of several structures, we considered the intake dam as the control point that defines the watershed used in this study. The hydraulic resource projects in Ecuador that are considered in this study include Delsatinagua, Jubones, Paute, Manduriacu, Toachi Pilaton, Coca-Codo, and Agoyan.
Parameters of Hydraulic Design
The total duration of the period of return in the design of hydraulic structures will vary, depending on the type of structure and population needs. In the EAM, the main hydraulic resource projects are water supply, hydropower projects, and sewer drainage systems. Each of these types of projects has a different period of return. The period of return can be one of the main return period values: 0.1%, 1%, and 10%. Even though these values have been regulated by the Ecuadorian Institute of Construction Regulations [10], it is important to note that these values can change depending on the different methodologies and data available. Table 1 and Figure 3 show the interaction between hydropower projects and drainage areas in the EAM.
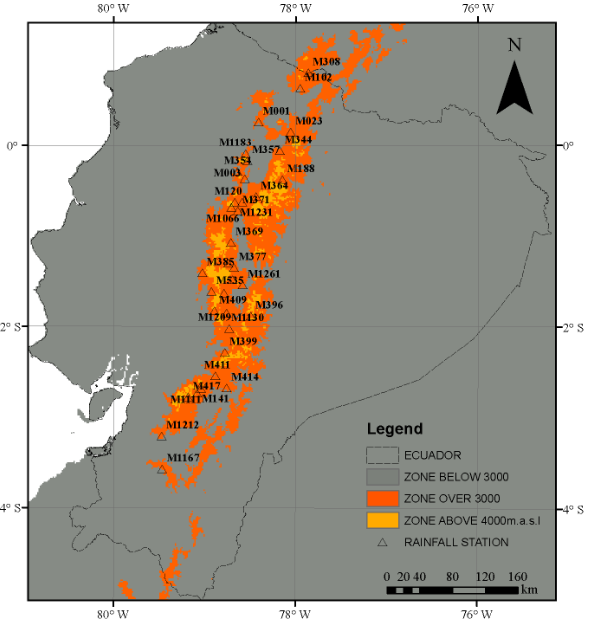
Location of rainfall stations in the EAM
For instance, the Manduriacu Hydropower Project interaction shows that 39% of the drainage area is located in the EAM.
The probability of 0.1% corresponds to a rainfall that has a period of return of 1,000 years, which is generally used in the design of the spillway in dams that are widely used in water supply and hydropower projects. The probability of 1% corresponds to a period of return of 100 years. That is used in most of the water supply structures. For instance, in Ecuador most water supply projects are based on the construction of water bottom intake and lateral intake structures in mountain streams in the EAM. Finally, the probability of 10% corresponds to 10 years of return period, which is widely used in sewer drainage systems cities. For example, the period of return in the design of micro- drainage in Quito is between 2 years to 30 years [11].
Additionally, the capacity of the reservoir in the hydropower projects is based on mean or median runoff values at the location of the dam. In this study we use the decadal rainfall variation as an indicator of the variation of the availability of runoff sources in the hydropower project.
RESULTS
Rainfall variation
The areas that are located above 3,000 MASL in the Ecuadorian Andean Mountains present two predominant seasonal rainfall distributions. Unimodal distribution presents the winter season during June and July, while bimodal distribution presents the dry season during August and September. For instance, stations M001, M003, M023, M102, M120, M308, M344, M354, M357, M364, M369, M385, M393, M535, M1231, M1066, and M1183 present a bimodal distribution. The stations M188, M377, and M396 present a unimodal distribution. The stations M390 and M1261 are not well-defined due to the limited amount of monthly data. Figure 4 shows the seasonal rainfall distributions in the zone of study.
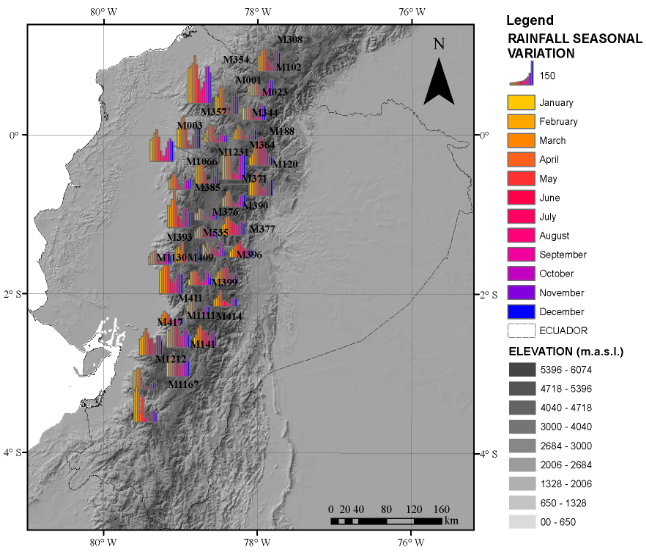
Seasonal Rainfall Variation in the EAM
The annual rainfall values of the stations located in the zone of study are shown in Figure 5. Although rainfall stations are located at elevations between 3,000 and 3,780 meters, they represent different climate regions. The station M1130 has an annual rainfall lower than 500 mm, having similar climate to an arid zone. The stations M023, M344, M399, M369, M371, M376, M377, M393, M411, M1065, M1183, and M1209 present annual rainfall between 500 mm and 700 mm. On the other hand, the stations M003, M357, M364, and M1111 have annual rainfall values greater than 1,300 mm.
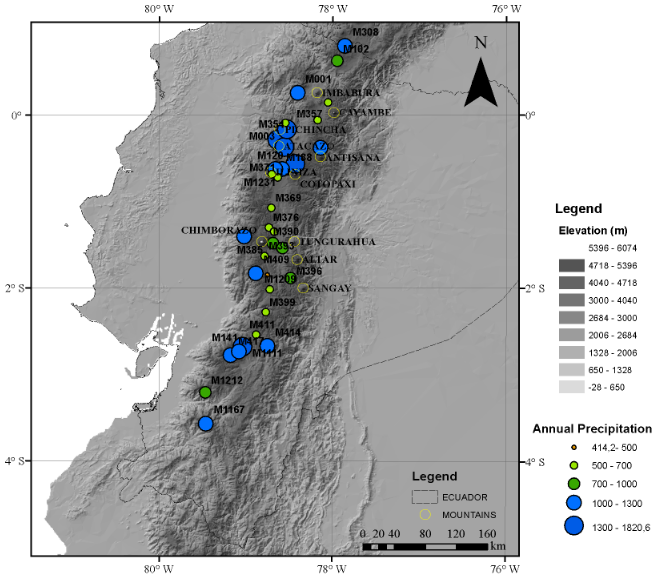
Spatial Accumulate Median Annual Rainfall in the EAM stations
The EAM regions located in zones above 3,000 m represent big percentages of drainage area for the main hydropower projects in Ecuador. Figure 7 shows the hypsometric curve, which helps to summarize the surface distribution of the hydropower projects compared to mean altitude. The Delsatinagua Project, located in the southern part, has the lowest percentage of 26%, while the Agoyan Project has the largest, with 87%. The Jubones Hydropower Project has 45% of its watershed located in the zone of study, Manduriacu 55% and Toachi Pilaton 50%. Figure 6 and Table 3 show the spatial distribution and the main features of the hydropower projects. Another important point is that although all rainfall stations are located between 3,000 and 3,780 m, there are projects that have a strong dependency of areas above 4,000 m like the Manduriacu, Coca, and Agoyan hydropower projects. In addition, it is important to point out that even though the hydropower projects require exhaustive monitoring systems, only two projects have stations with continuous daily data since 1964. The Paute Project has the station M141, and the Agoyan Project contains the stations M369, M376, M377, M393, and M396.
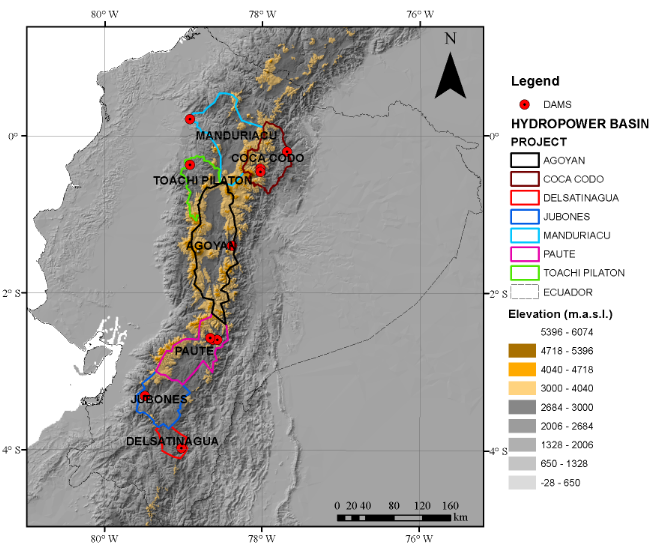
Main watersheds that contribute to hydropower and water supply projects in Ecuador
The Manduriacu, Toachi Pilaton, and Jubones Hydropower Projects have their drainage area towards the Pacific Coast, while the Coca Codo, Agoyan and Paute Projects have their drainage areas towards the Amazon Rainforest. Managing these hydropower projects relies on understanding rainfall-runoff processes in the watershed. However, different rainfall distribution in the same area exposes the complexity of runoff sources, resulting in different hydropower production. For example, the Manduriacu Project generates 65 KW, while the Coca Codo Project generates 1,500 KW.
Analysis of data with the Gumbel Curve and Decadal Variation
The probabilistic Gumbel Curves of each station to those completed during the period 1964-2015 are shown in Figure 10. The stations with complete representative data are M003, M102, M141, M369, M376, M377, M393, and M396. Representative parameters used in the Gumbel method such as the values of extreme rainfall daily event, the year of the event, and their comparison with ENSO event and the return period are shown in Table 2. Additionally, the decadal variation of the same stations is exposed in Figure 9.
The rainfall station M003, named Izobamba, is located at 3058 m in the southern part of Quito, Pichincha Province. This station has continuous registered data since 1964 and is located in the watershed of the Manduriacu Project. Figure 10 shows the greatest extreme precipitation event of 84.5 mm. This event took place in this station on 25 March 2009 with a probability of 0.5%, representing a period of design of 500 years. It is important to point out that this event does not match with the ENSO year. The decadal variation of the station in Figure 11 shows that monthly rainfall was greater during the decade 1994-2003.
The rainfall station called El Angel with notation M102 is located in the northernmost part of Ecuador in Espejo, Carchi Province. This station has near-complete data during the period 1964-2004. However, during the last decade of 2005-2015, 14% of the daily data was already missing. The extreme rainfall event has a return period of 90 years. Figure 11 shows that the driest decade was 1994-2003. There are no hydropower projects influenced by the results of this station.
The station M141, named El Labrador, is located in the southern part of Ecuador in Cuenca, Azuay Province. The greatest extreme rainfall event had a value of 67.3 mm on 3 September 2000. This extreme precipitation event has a period of return of 700 years and drains towards the Paute Project. This extreme event matched with La Niña’s weak year between 2,000 and 2001. This return period increased the risk of failure of the complementary structures used in hydropower projects such as water bottom and lateral intakes. When analyzing the decadal variation of this station, it is important to point out that the dry season during August and September is becoming longer compared to the decade between 1964 and 1973. This change increases the risk of water scarcity in the yearly operation plans in the future of the project.
The station M369, named Cusubamba, located in Salcedo, Cotopaxi Province, presents an extreme precipitation event with a return period of 100 years. The decadal variation shows that the years 1974 to 1983 represented a rainy period. This station is located in the drainage area of the Agoyan Project.
The station M376, named Pilahuin, is located in Ambato, Tungurahua Province. The extreme precipitation event has a value of 42.5 mm on 13 April 2004 during the event of El Niño. This station drains toward the Agoyan Project. The decadal variation of rainfall in Figure 9 shows that in recent periods the rainy season is stronger compared to the first decade of 1964-1973.
The station M377, named Tisaleo, is located in Tisaleo, Tungurahua Province. This station has extreme rainfall of 190 mm on 28 June 2005 with a return period of 8,000 years, and there was no ENSO event during that year. This station is located in the watershed that drains the Agoyan Project. Although the decadal distribution is relatively homogeneous, the last decade 2004-2015 presented an increase in rainfall during June and July. Since the design of the dam’s spillway is based on the probability 0.01% which corresponds to a return period of 10,000 years, this rainfall value should be carefully evaluated and validated in order to consider a high risk of flooding or failure. The risk increases when the extreme rainfall occurs during the rainy season in June and July.
The station M393, named San Juan Chimborazo, is located in Riobamba, Chimborazo Province. The extreme rainfall event had 130.8 mm of rainfall on 30 March 1964. This event has a return period of 1,000 years. This year Ecuador had a La Niña weak event. The decadal variation in Figure 9 shows the rainy seasons during the period 1974-1983. Finally, the station Alao, M396, presented an extreme rainfall event of 87 mm on 24 June 1986. This station is located in Riobamba in Chimborazo Province. The return period of this event is 900 years. The decadal variation of this station changes from the rainy period 1984-1993, to drier periods such as 1994-2003.
Only a few stations present coincidental dates of the extreme precipitation events with ENSO years. Summarizing the results of the comparison between both in the 35 stations: 10 stations experienced extreme precipitation events during La Niña event and 4 during El Niño. According to Tobar and Wyseure [12] the zone of study belongs to a highland seasonality type where the rain trends do not present a dependency on ENSO events.
CONCLUSIONS
Annual, seasonal and decadal rainfall variations behave differently at each station. Although understanding how global and local atmospheric mechanisms with topography interact is a difficult task, insights about how rainfall-runoff processes interact is important to manage water resource projects such as hydropower projects. In this study we used the stations with robust data to analyze the comparison of extreme rainfall events, return periods of design of hydraulic structures, and ENSO years. Also, we used the data to analyze possible decadal trends. The results showed that stations M003, M141, M377, and M393 have experienced extreme precipitation events that could increase the risk of failure of the hydraulic structures.
Additionally, it is important to point out that although some stations have few daily data sets, monitoring the EAM in the hydropower projects is important to manage water resources. Hence, stakeholders could make a wiser decision about the paramo conservation in zones of more water production in rainy zones. For instance, stations M1212 Pucará and M1167 Sabadel, located in a watershed that drains towards the Jubones Project, presented different annual rainfall with 873 mm and 1,162 mm, respectively.
Monitoring rainfall processes not only depends on rainfall stations, but also on other methodologies based on weather radar data. Rollenbeck and Bendix [6] presented excellent results about rainfall distribution in “Nudo de Loja” located in the south of Ecuador, considering global atmospheric processes such as easterlies, and local geographical effects on atmospheric circulation that explain drier and wetter zones within the same zone of study. It is important to consider this type of study in other areas, most importantly at rainfall stations. For instance, the Coca Hydropower Project is the largest in Ecuador. However, there is only one rainfall station in the southern part of its drainage area.
Future Research
Future research could be focused on the comparison of the flood values used in the design of hydraulic structures with the current data available. Additionally, this work is carrying us to important changes on how rainfall is affecting water resources projects in the EAM. The next research phase should be focused on the effect that future anomalies could produce on the biogeochemical interactions downstream. For example, geochemical composition and climatic interactions on sediments in the Andes Mountains contribute to higher chemical weathering rates associated to CO2 consumption [13]. Also, biodiversity in the Andean flank of western Amazonia could be radically altered by climate change [14]. Unfortunately, there is little research about biogeochemical interactions in rivers. As a result, it is important to research these fields [15].
ACKNOWLEDGEMENTS
This study was developed thanks to the support of the Central University of Ecuador through the PhD Program Project in coordination with the University of New Mexico in the United States. Furthermore, the authors want to recognize the National Institute of Meteorology and Hydrology (INAMHI) for contributing daily rainfall data from the stations at the EAM.
AUTHORS’ CONTRIBUTIONS
Paulina Lima conceived the research, tabulated data, analyzed the data, interpreted the results and wrote the document. Jorge Santamaria helped with developing maps, data analysis, revised the manuscript critically and collaborated with editing. Margarita Flor revised the manuscript critically and collaborated with editing.
REFERENCES
[1] M. F. Price, L. Jansky, y A. A. Iastenia, Key Issues for Mountain Areas. Tokyo, JAPAN: United Nations University Press,
[2] Buytaert, W., Celleri, R., Willems, P., De Bievre, B., & Wyseure, G. (2006). Spatial and temporal rainfall variability in mountainous areas: A case study from the south Ecuadorian Andes. Journal of hydrology, 329(3-4), 413-421. doi: https://doi.org/10.1016/j.jhydrol.2006.02.031
[3] A. Correa et al., (2017) Temporal dynamics in dominant runoff sources and flow paths in the Andean Páramo. Water Resources Research, 53(7), 5998-6017. doi: https://doi.org/10.1002/2016WR020187
[4] Beven, K. (2008). On doing better hydrological science. Hydrological Processes: An International Journal, 22(17), 3549- 3553. doi: https://doi.org/10.1002/hyp.7108
[5] United States. Bureau of Reclamation. (1987). Design of small dams. US Department of the Interior, Bureau of Reclamation.
[6] Rollenbeck, R., & Bendix, J. (2011). Rainfall distribution in the Andes of southern Ecuador derived from blending weather radar data and meteorological field observations. Atmospheric Research, 99(2), 277-289. doi: https://doi.org/10.1016/j.atmosres.2010.10.018
[7] Veettil, B. K., Maier, É. L. B., Bremer, U. F., & de Souza, S. F. (2014). Combined influence of PDO and ENSO on northern Andean glaciers: a case study on the Cotopaxi ice-covered volcano, Ecuador. Climate dynamics, 43(12), 3439-3448. doi: https://dx.doi.org/10.1007/s00382-014-2114-8
[8] Chow, V. T., Maidment, D. R., & Mays, L. W. (1988). Applied hydrology.
[9] Langbein, W. B. (1947). Topographic characteristics of drainage basins.
[10] CPE INEN, (1992) Código Ecuatoriano de la Construcción C.E.C: Normas para estudio y diseño de sistemas de aguapotable y disposición de aguas residuales para poblaciones mayores a 1000 habitantes.
[11] Guevara Espín, K. M. (2010). Empresa metropolitana de alcantarillado y agua potable de Quito (EMAAP-QUITO): Propuesta de estrategias comunicacionales para involucrar a la ciudadanía quiteña, en la prevención de los eventos adversos que trae consigo la estación invernal (Bachelor›s thesis, Quito: Universidad de las Américas, 2010).
[12] Tobar, V., & Wyseure, G. (2018). Seasonal rainfall patterns classification, relationship to ENSO and rainfall trends in Ecuador. International Journal of Climatology, 38(4), 1808-1819. doi: https://doi.org/10.1002/joc.5297
[13] Moquet, J. S., Crave, A., Viers, J., Seyler, P., Armijos, E., Bourrel, L., ... & Pombosa, R. (2011). Chemical weathering and atmospheric/soil CO2 uptake in the Andean and Foreland Amazon basins. Chemical Geology, 287(1-2), 1-26. doi: https://doi.org/10.1016/j.chemgeo.2011.01.005
[14] Cárdenas, M. L., Gosling, W. D., Sherlock, S. C., Poole, I., Pennington, R. T., & Mothes, P. (2011). The response of vegetation on the Andean flank in western Amazonia to Pleistocene climate change. Science, 331(6020), 1055-1058. doi: https://dx.doi.org/10.1126/science.1197947
[15] Heglund, J. M., & Barkdoll, B. D. (2010). Can Climate Change Affect Sediment Transport in a Watershed?. In World Environmental and Water Resources Congress 2010: Challenges of Change (pp. 1643-1652). doi: https://doi. org/10.1061/41114(371)173